
Main Window
Main Window
The main window is divided into four functional areas that stay visible at all times.
Menu Bar
File Menu
Items appear in this exact order in the File menu. No File menu items have keyboard shortcut accelerators.
| Item | Description | |
|---|---|---|
| New Capture | Clears all current capture data; preserves all settings, channel names, decoder configuration, attached Custom Decoders, and trigger settings | |
| Open Capture | Opens a .active capture file |
|
| Save Capture | Saves the entire current capture to a .active file |
|
| Save Between Cursors | Saves only the data between X1 and X2 cursors to a new .active file |
|
| Open Configuration | Loads settings from a .active configuration file (same extension as captures, but smaller because it stores no waveform data). Hidden on Active Debugger. |
|
| Save Configuration | Saves all current settings to a .active configuration file. Hidden on Active Debugger. |
|
| (separator) | ||
| Export Data Between Cursors | Exports all decoded data between X1 and X2 to a CSV file | |
| Export AI Snapshot Between Cursors | Saves the AI Snapshot for the X1-X2 range to an .aft file |
|
| Open My Decoder Library | Opens the folder where your Custom Decoder .py files live, in the system file explorer |
|
| Recent Files | Submenu listing up to 5 recently opened or saved .active files |
|
| (separator) | ||
| Exit | Closes the application (prompts to save if unsaved data exists) |
View Menu
The View menu shows and hides the individual right-side panel tabs. Each item toggles one tab in the tab bar.
| Item | Description | |
|---|---|---|
| Show Inputs | Shows or hides the Inputs tab | |
| Show Triggers | Shows or hides the Buffer & Triggers tab | |
| Show Outputs | Shows or hides the Outputs tab (Active-Pro and Active-Pro Ultra only) | |
| Show Decode List | Shows or hides the List tab | |
| Show Settings | Shows or hides the Settings tab | |
| Show Notes | Shows or hides the Notes tab | |
| Show Source Code | Shows or hides the Source Code tab | |
| Show Live UI | Shows or hides the Live UI tab | |
| Show Devices | Shows or hides the Devices tab | |
| Show Markers | Shows or hides the Markers tab |
Note: Dark Mode, Light Mode, Always On Top, and Not Always On Top now live on the Setup menu (see below), not the View menu.
Below the tab toggles, the View menu also lists the common waveform commands, each with its keyboard shortcut, so they are easy to find and discoverable in the Command Palette:
| Item | Shortcut | Action | ||
|---|---|---|---|---|
| Command Palette… | Ctrl+K | Opens the fuzzy command launcher (see below) | ||
| Zoom All | Ctrl+Home | Fit the entire capture on screen | ||
| Zoom Cursors | Ctrl+Shift+X | Zoom to the range between the X1 and X2 cursors | ||
| Zoom In / Zoom Out | I / O | Zoom in or out at the mouse position | ||
| Capture / Stop Capture | Space | Start or stop the capture | ||
| Display Live Data | Ctrl+L | Jump to the live edge and resume auto-scroll | ||
| Previous / Next Trigger | Ctrl+Left / Ctrl+Right | Step to the previous or next recorded trigger | ||
| Center Trigger | Ctrl+T | Center the current trigger in the window | ||
| Apply Changes | Ctrl+Enter | Reprocess the capture with current settings | ||
| Measure Mode | M | Toggle hover measurements | ||
| Add Marker | Ctrl+M | Add a marker at the mouse position | ||
| Place X1 / X2 Cursor | 1 / 2 | Place the X1 or X2 cursor at the mouse position |
Command Palette (Ctrl+K)
Press Ctrl+K (or choose View > Command Palette…) to open a search box in the center of the window. Start typing and it fuzzy-matches every command in the menus, hit Enter to run the highlighted one, or use the arrow keys to pick from the list. It is the fastest way to reach a command without hunting through menus, and a quick way to discover what the application can do. Location-based commands (Add Marker, Place Cursor, Zoom In/Out) act at wherever the mouse was when you opened the palette.
Setup Menu
The Setup menu holds the Quick Setup shortcuts, calibration, window sizing, firmware update, and the theme and window-stacking options. It is present on all three hardware models. On the Active Debugger, the items that depend on analog inputs or firmware download are hidden: the analog Quick Setup items, both Calibration items, and Update Device Firmware. Everything else, including the Resize Screen options and the theme / Always On Top items, stays visible.
Items appear in this exact order in the menu.
| Item | Description | Hidden on Active Debugger | ||
|---|---|---|---|---|
| Quick Setup - Active Debug Port | Configures Device A for Active Debug Port 2-wire mode | no | ||
| Quick Setup - All Digital Channels | Enables the logic input channels | no | ||
| Quick Setup - All Analog Channels | Enables the analog input channels | yes | ||
| Quick Setup - All Digital and Analog Channels | Enables all logic and analog inputs simultaneously | yes | ||
| Quick Setup - I2C Bus | Configures Device A for I2C decoding | no | ||
| Quick Setup - UART Bus | Configures Device A for UART decoding | no | ||
| Quick Setup - SPI Bus | Configures Device A for SPI decoding | no | ||
| (separator) | ||||
| Calibrate Analog Channels | Runs the analog channel calibration procedure | yes | ||
| Show Calibration Values | Displays the stored calibration offset and gain values | yes | ||
| Resize Screen (16:9) | Resizes the window to a standard landscape (16:9) shape | no | ||
| Resize Screen (9:16) | Resizes the window to a tall portrait (9:16) shape | no | ||
| Update Device Firmware | Downloads and programs updated firmware to the connected device | yes | ||
| (separator) | ||||
| Dark Mode | Switches the entire application to the dark theme | no | ||
| Light Mode | Switches the entire application to the light theme | no | ||
| Always On Top | Keeps the application window above all other windows | no | ||
| Not Always On Top | Returns the window to normal stacking order | no |
Help Menu
Items appear in this order. The menu has no other entries.
| Item | Description | |
|---|---|---|
| User's Manual | Opens the online user documentation | |
| Contact Support | Opens a support contact dialog | |
| About | Shows the application version number and build information |
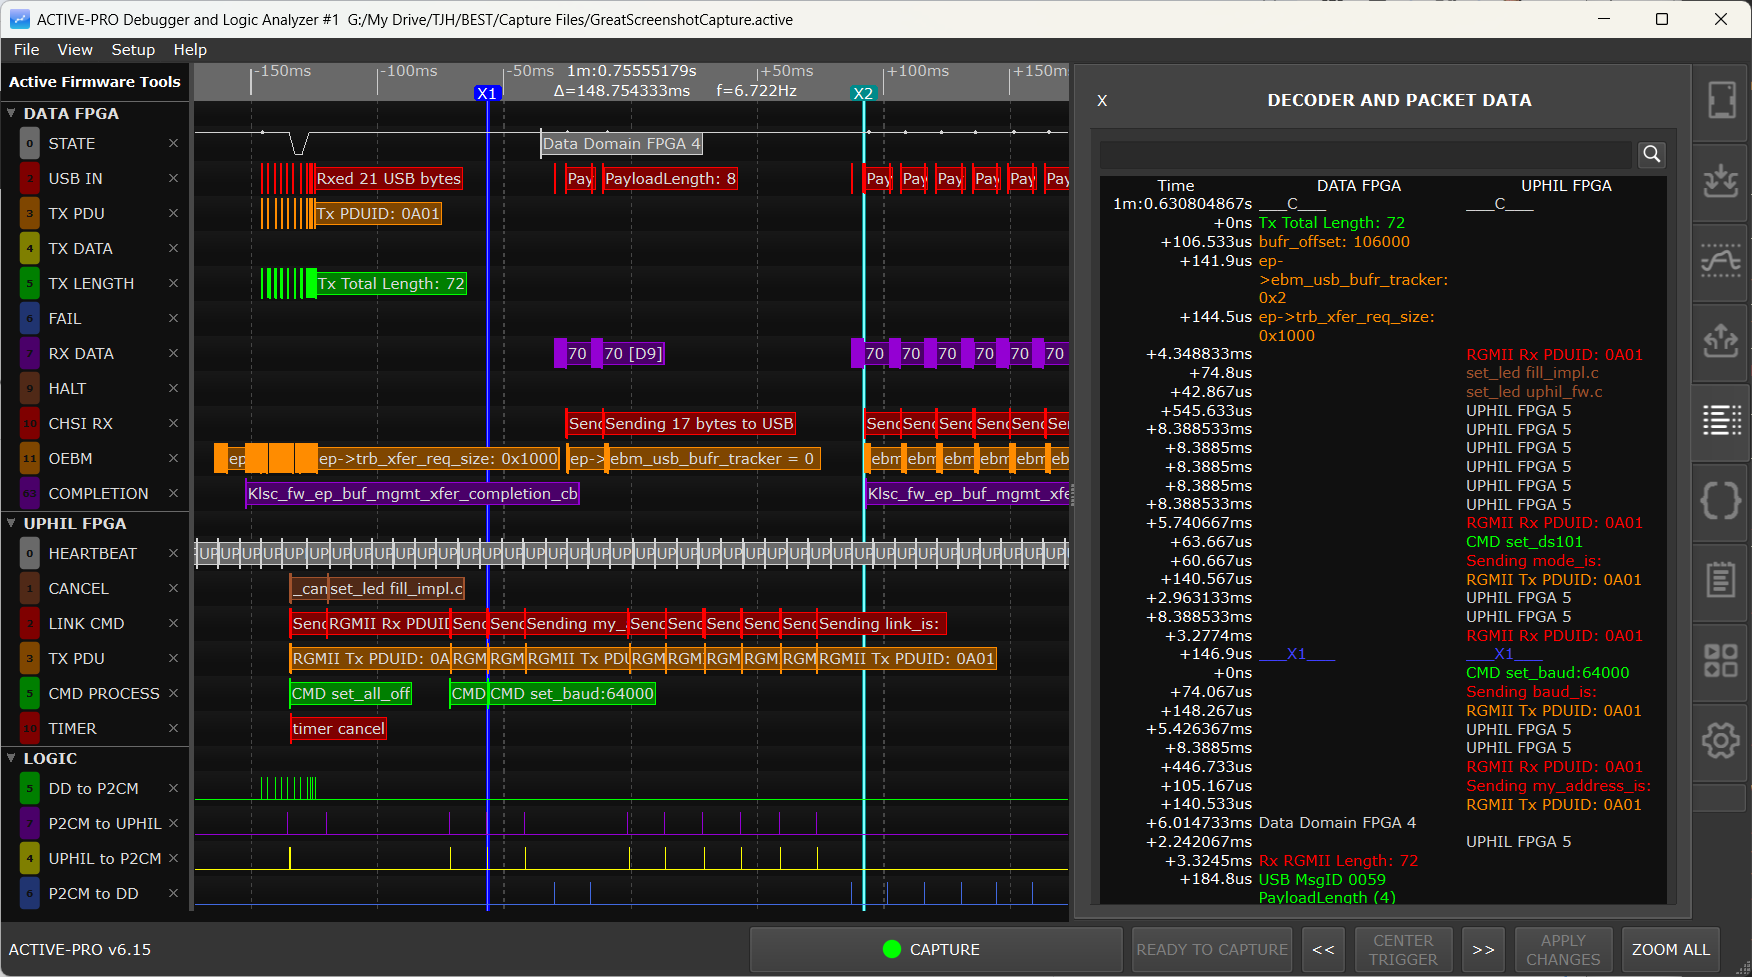
Waveform Area
The waveform area takes up the center of the window. It has two sub-components.
Timeline Ruler
A horizontal ruler at the very top of the waveform area shows absolute time. The scale adjusts automatically as you zoom: it might show seconds when zoomed out and nanoseconds when zoomed in. The ruler is always aligned with the channel rows below it.
The X1 and X2 cursor markers appear as vertical lines running the full height of the waveform area. The Current Cursor (labeled C) follows the mouse as you hover over the waveform.
When the trigger system is active, a small rounded trigger status badge floats over the timeline ruler showing READY, TRIGGERED, or a countdown like Stopping in 3s. A solid red trigger cursor is drawn through the waveform at the focused trigger event, and a small red diamond with a white T marks each individual trigger sample. See Buffer & Triggers.
Channel Rows
Below the timeline ruler, each captured channel appears as a horizontal row. Each row has two parts:
- Name column (left): the channel name, and for analog channels, the voltage at the Current Cursor position
- Waveform panel (right): the actual waveform, decoded text, packet data, or Custom Decoder annotations for that channel
Which channel groups appear depends on the hardware model:
| Channel Group | Active Debugger | Active-Pro | Active-Pro Ultra | |||
|---|---|---|---|---|---|---|
| Logic (D0-D7) | no | yes | yes | |||
| Analog (CH1-CH3) | no | yes | no | |||
| Analog (CH1-CH8) | no | no | yes | |||
| Active Debug Port, Device A | yes | yes | yes | |||
| Active Debug Port, Devices B, C, D | no | yes | yes | |||
| Custom Decoder annotation rows | Port A only | Ports A-D | Ports A-D |
Channels are organized into collapsible groups. Click a group header row to expand or collapse all channels in that group. The group header shows a right-arrow icon when collapsed and a down-arrow icon when expanded.
Name Column
The left column on each channel row shows the channel name. Several interactions are available here:
Rename a channel: Double-click the channel name to enter edit mode. Type the new name and press Enter to confirm.
Reorder channels: Click and hold on the name column of any channel row (the tab on the left), then drag it up or down to a new position. Release to drop it in place. The order is saved in the capture file.
Delete a waveline: Press the small X near the signal name. This removes the waveline from the screen. Once deleted, a small + icon appears in that section's header.
Restore deleted wavelines: Click the + icon in the section header to restore all deleted wavelines for that group.
Collapse or expand a group: Click the group header row (the darker row that labels a channel group, such as "Device A") to collapse or expand all channels in that group.
For analog channels, the name column also shows the current signal voltage at the Current Cursor's position, updating continuously as the cursor moves.
Right-Side Panel
The right-side panel is a tabbed area docked to the right edge of the window. Tabs run vertically along its right edge; click any tab to bring that view to the front. The X button at the upper-left of each panel dismisses it back to the tab bar.
Each tab is an icon along the right edge; hovering over it shows the name listed below. Tabs appear in this fixed order from top to bottom, with the same set on every hardware model. The Outputs tab is the only one whose tab bar entry is hidden on the Active Debugger:
| Tab (hover name) | Active Debugger | Active-Pro | Active-Pro Ultra | |||
|---|---|---|---|---|---|---|
| Connected Devices | yes | yes | yes | |||
| Inputs and Bus Decoders | yes (threshold only) | yes (full) | yes (full) | |||
| Buffer & Trigger | yes | yes | yes | |||
| Outputs | no | yes | yes | |||
| Decoder and Packet Data (toggled by View ▸ Show Decode List) | yes | yes | yes | |||
| Source Code Viewer | yes | yes | yes | |||
| Notes | yes | yes | yes | |||
| Markers | yes | yes | yes | |||
| Live UI | yes | yes | yes | |||
| Settings | yes | yes | yes |
The Decoder and Packet Data tab holds the decoded event list and PacketPresenter output.
Each tab is described in detail in its own chapter. Use the View menu to show or hide individual tabs from the tab bar if your screen space is limited.
Status Bar
The status bar runs across the bottom of the window. It contains, from left to right:
Left side, version label: Reads Active-Pro v<version>. The version string matches the build you are running and is the first thing to quote when reporting an issue.
Center, status messages: Transient text describing what the application just did or is currently doing, cursor positions, delta time between X1 and X2, "Configuration Successful", "Processing Capture Samples: N%", "Custom Decoder 'X' complete.", "AI Snapshot Copied", file-save confirmations, warnings, and operation status. Read this area when you are wondering what just happened.
Center, progress bar: A horizontal progress bar appears in the center area only while a long-running operation is underway, connecting to the pod, downloading the FPGA bitstream, programming firmware, erasing flash, or large file save/load. It hides itself again when the operation finishes. The label inside the bar tells you what is in progress (for example, Connecting, Downloading FPGA, Programming Firmware 42%).
Right side, eight action buttons:
CAPTURE / STOP CAPTURE / CANCEL / CANCELLING… / STOPPING…
Starts or stops the current capture, or cancels Custom Decoder processing. The label reflects the current capture state. Equivalent to pressing Space.
- CAPTURE - no capture is running; click or press Space to start one.
- STOP CAPTURE - a live capture is running; click or press Space to stop. The application then runs any attached Custom Decoders, Packet Presenters, and Trigger Search.
- CANCEL / CANCELLING… - a Custom Decoder pipeline is running after the capture stopped; click to cancel the remaining decoders. Annotations already produced stay in the display.
- STOPPING… - the capture is finishing its in-flight USB drain before halting.
LIVE / DISPLAY LIVE DATA / SHOWING LIVE DATA / READY TO CAPTURE
Jumps to the end of the capture and re-enables auto-scroll to follow incoming data. The label reflects the current scroll state:
- SHOWING LIVE DATA - the view is pinned to the live edge.
- DISPLAY LIVE DATA - you have scrolled back into history; click to return to live.
- READY TO CAPTURE - no capture has been started yet.
<< (Previous Trigger / Pan Left)
Dual-purpose. Jumps the waveform backward to the previous recorded trigger when at least one is visible on screen; otherwise pans the waveform left by half its visible width. Auto-repeats while held.
Tool tip: Prev trigger if one is on screen; otherwise pan left half-screen.
CENTER TRIGGER
Re-centers the current trigger event in the waveform window at the current zoom level. Disabled (grayed out) when no triggers have been recorded yet.
>> (Next Trigger / Pan Right)
Mirror of <<. Jumps to the next recorded trigger when one is on screen, otherwise pans the waveform right by half its visible width. Same auto-repeat behavior.
Tool tip: Next trigger if one is on screen; otherwise pan right half-screen.
APPLY CHANGES
Reprocesses the entire capture against the current Custom Decoders, Packet Presenters, and Trigger Search settings, in that order. Enabled only when settings have changed since the last processing pass and no live capture is running. Use this any time you tweak a decoder script, a packet-presenter script, gear-dialog parameters, the decoder picker selection, or a trigger setting and want the change to take effect against data already captured.
Note: APPLY CHANGES can take noticeable time on very large captures. The trigger diamonds, cursor snap, and PP rows all update when it completes.
ZOOM ALL
Instantly fits the entire capture on screen, regardless of current zoom level.
MEASURE
Toggles Measure Mode, the hover read-out that shows frequency, period, amplitude, and other measurements for whatever analog or logic waveform is under the mouse, with no cursors to place. The button glows green while Measure Mode is on. Equivalent to pressing M. See Waveform View for the full description.
The trigger navigation group (<<, CENTER TRIGGER, >>) and APPLY CHANGES are described in more detail in Buffer & Triggers.
Themes
The application supports dark and light themes, selectable from Setup > Dark Mode and Setup > Light Mode. The entire application UI, waveform backgrounds, panel backgrounds, text, buttons, and the trigger badge, switches with the theme. The chosen theme is a global preference and applies to all running pods.
Always on Top
Setup > Always On Top keeps the application window above all other windows, including your IDE. This is useful when you want to monitor live capture data while writing firmware in a separate editor on the same screen.
Setup > Not Always On Top returns it to normal window stacking behavior.
Like the theme, Always On Top is a global preference that applies to every running instance.