
Do you know what your firmware is really doing?
Stand sure with Active-Pro - the only logic analyzer that captures variables, state, and execution from up to four processors, time aligned with decoded buses, hardware signals, and power in one live capture. See your firmware in real-time. No halting. No breakpoints. No slowdowns. For you and your AI.
DEBUGGING NOW AT
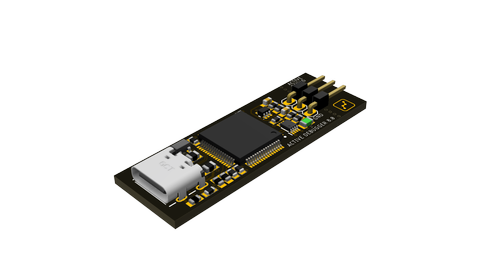
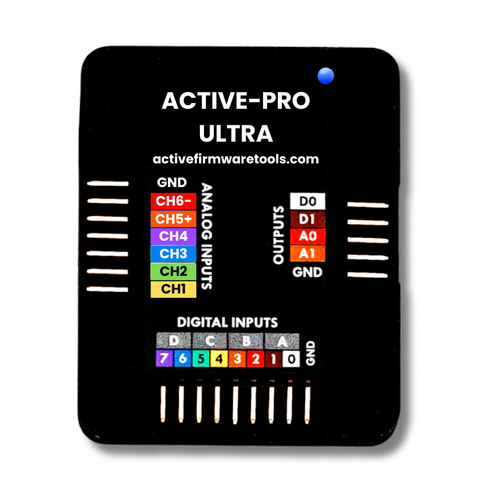
Three instruments. One debug platform.
Every model shares the same capture software, the same Active Debug Port (ADP), and the same .aft export pipeline. Start where your project needs you to start. Scale up without relearning the tool.
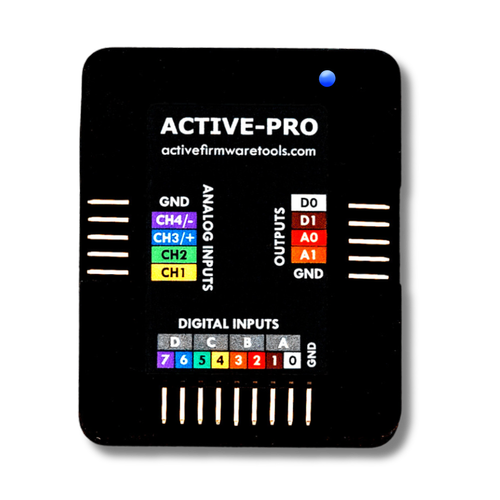
Near-zero firmware impact, from GPIO to SWD.
The Active Debug Port (ADP) delivers sub-microsecond output so instrumentation runs alongside your firmware instead of interrupting it. Drive it from simple GPIO for quick bring-up, or from SPI and SWD to offload the processor completely.
Add a single ADP output call anywhere in your firmware — in a state machine, a control loop, anywhere execution flows. Clock and data lines are automatically sensed on connect. PC-side setup is fully automatic. No configuration required.
Connect, press capture, see data.
Plug in the Active-Pro, press capture, and your instrumentation events appear on the timeline immediately. No driver configuration. No sample rate tuning. No channel assignment. The hardware senses everything automatically and PC-side setup is fully automatic.
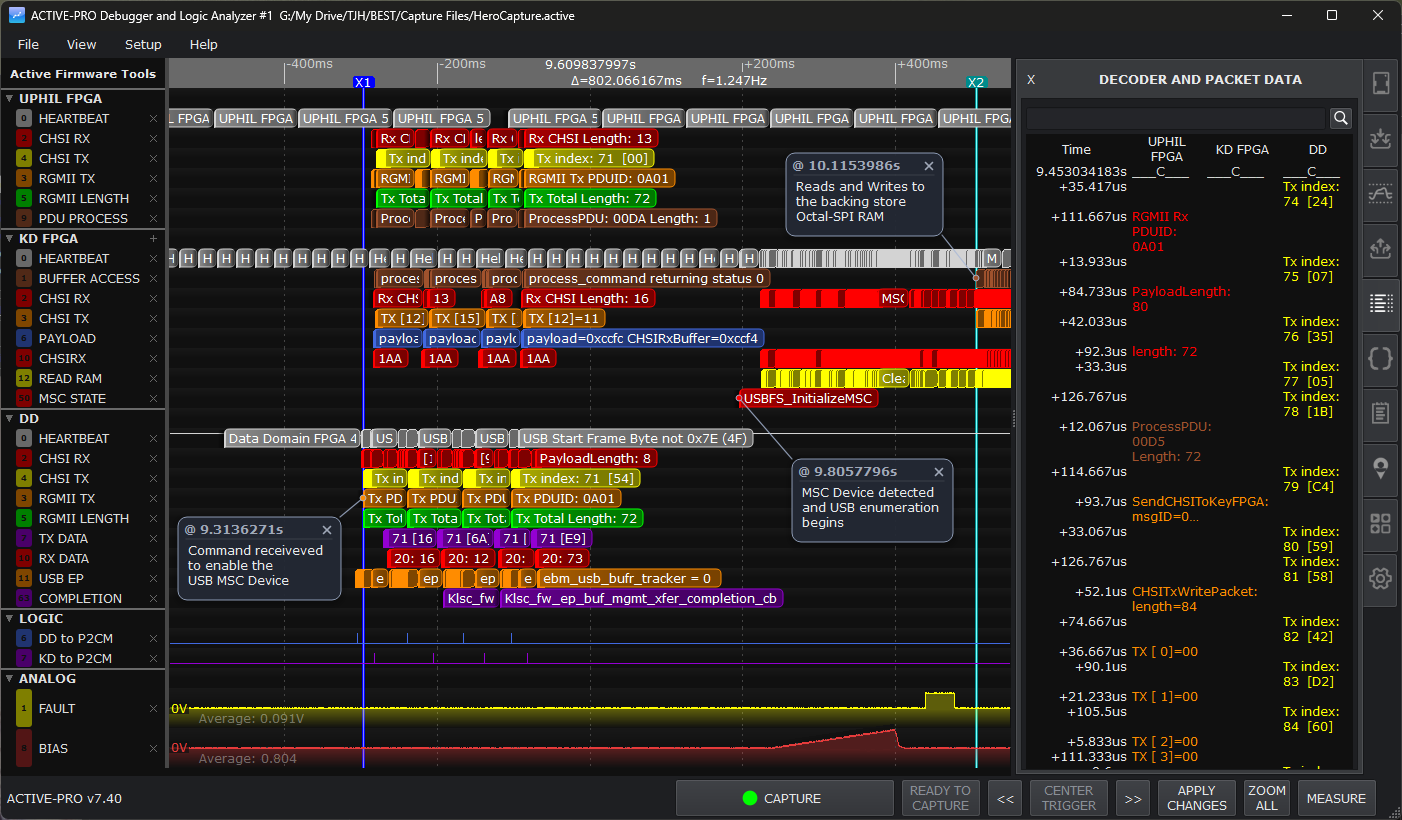
Cause and effect, across your entire system.
Firmware debug output, state transitions, hardware signals, and bus activity captured in sync and visualized live. Whether you're working on a single MCU or a mesh of processors and FPGAs, it all lines up on one timeline.
Watch firmware algorithms run
Live internal variables as your algorithm executes. Watch loop iterations, filter coefficients, and intermediate values update in real time. No breakpoints, no timing disruption.
See firmware states next to hardware
States and debug output alongside hardware signals on a synchronized timeline. Instantly see cause and effect across your code, I/O, and communication events, even across multiple processors.
Correlate bus traffic to the firmware sending it
See both sides of the communication. What's on the bus and what your firmware is doing to send and receive it. Packet Presenter decodes I2C, SPI, UART, CAN, and more, lined up with the code that produced them.
Trigger on the exact moment
Set a trigger and the capture centers on the event that matters. Auto, Normal, and Single modes work the way they do on a scope. When a trigger fires off-screen, one click jumps you straight to it. No more scrolling through a capture looking for the one transition you care about.
Capture straight to RAM
Captures land in memory instead of streaming to disk. Capture is faster, scrolling and zoom stay instant across the whole record, and disk I/O never competes with your data. Live view while recording, with multiple data streams overlaid for full context.
Your capture. Your AI. Your call.
Copy a region and paste it into any AI chat. Connect Claude Desktop via MCP and let it drive the instrument directly. Or automate the whole workflow with the built-in Automation API with scripted captures, searches, and file saves without touching the UI. Three ways in. Same data either way.
Write decoders for your own protocols
Built-in decoders cover I2C, SPI, UART, CAN, and more. When your design speaks something custom, write your own. Define the decode logic for any digital or analog protocol you run: proprietary framing, a sensor's private register stream, a non-standard bus. Active-Pro turns it into labeled fields right on the timeline, the same as a standard decode.
Hand your capture to an AI. Ask questions about it.
Two new tools in Active-Pro put your capture data into an AI's hands, in the format the AI actually understands. No screenshots. No guesswork. No re-explaining what the system does every time.
Copy a region. Paste into any AI.
Right-click drag to select a time range on the waveform. Press Ctrl+C. A plain-text capture in Active Firmware Trace (.aft) format lands on your clipboard. Paste it into Claude, ChatGPT, Gemini, or any other chat interface and start asking questions.
What's included: every visible channel in the selection, timestamps, bus decodes, analog readings, logic transitions, plus anything you wrote in the Notes tab as context. No files to upload. No plugins to install. No privacy tradeoffs beyond the AI you already chose.
Let the AI run the instrument.
Connect Claude Desktop to Active-Pro with the included Model Context Protocol server and the AI can drive the application directly. Start and stop captures, search decoded data, drive analog and digital outputs, save files, export snapshots, all from plain-English instructions.
Build automated test loops without writing a test framework. Ask Claude to run a capture, search for an ERROR, save the file if it finds one, and try again. The AI decides which calls to make, in what order, based on what you asked for.
From the field.
This is a fantastic tool. I wish I had this 20 years ago. I'm surprised no MSO or logic analyzer has this kind of capability. Kudos to you for developing this.
With Active-Pro I was able to immediately find an issue with my multi-processor application. I love my Active-Pro firmware debugging tool.
We build it into every processor and FPGA. It captures the exact data we need to fix bugs and validate our complex systems.
This tool is up there on my favorites list. If you're into hardware and firmware development, you must absolutely give this a try.
Stop guessing. Start knowing.
Everything your firmware is doing. Everything your hardware is doing. On one timeline. Ready to hand to your AI when you need a second set of eyes.