
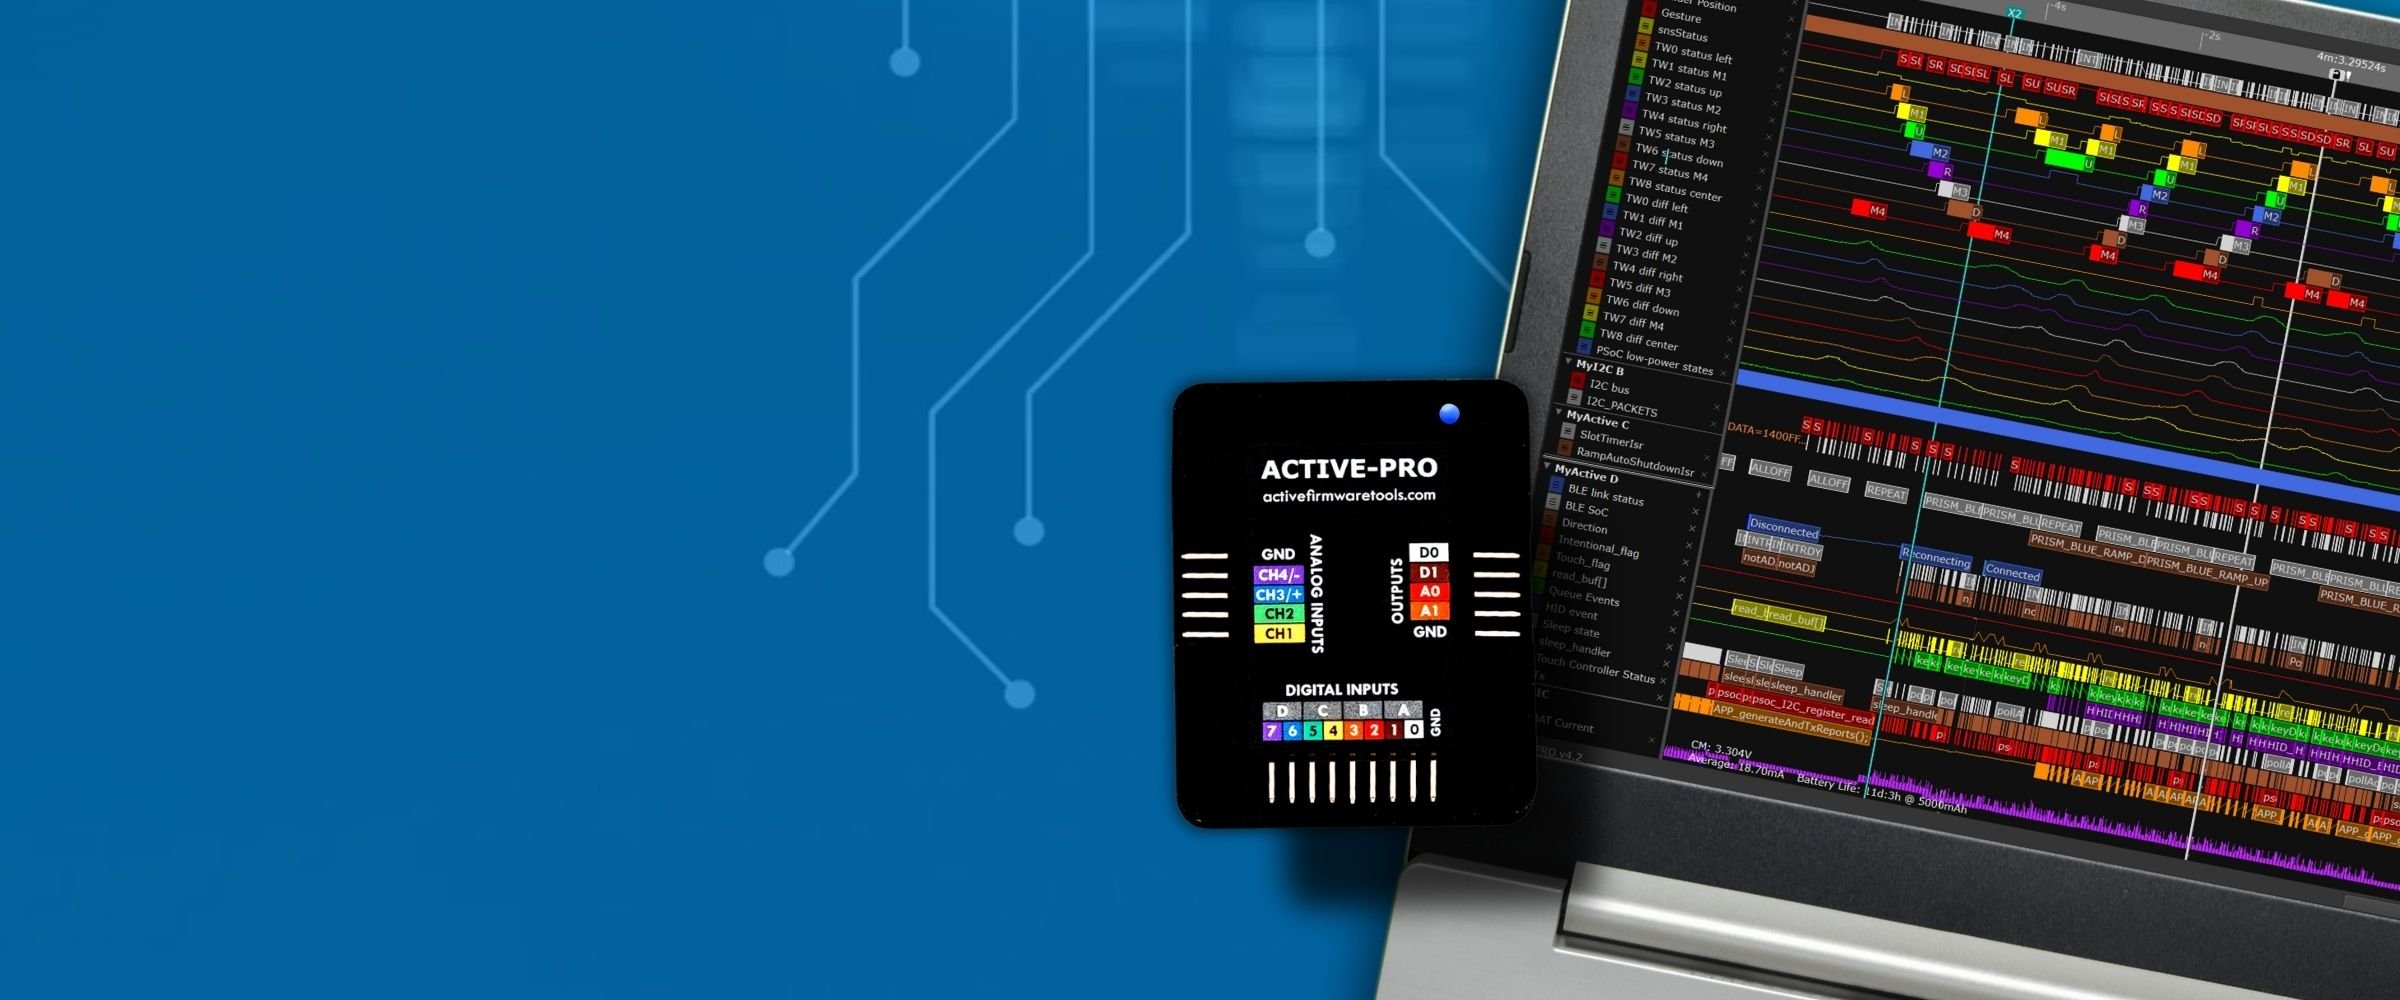
Join us as we discuss the complexity of debugging multi-processor systems, which involve multiple microprocessors, FPGAs, and logic components interacting simultaneously. Existing tools in the market often focus on single processors, requiring synchronization of multiple tools for effective debugging. The speaker showcases a real working system with multi-processors, demonstrating how data is sampled, processed, and transmitted wirelessly between processors for debugging purposes. The video also covers using a logic analyzer to decode and interpret data from an I2C bus, utilizing additional channels to debug multiprocessor systems, and measuring current using the firmware debugger. The Active-Pro firmware debugger is a powerful tool that includes a logic analyzer, oscilloscope, hardware bus decoders with custom packet decoding, and a current analyzer, making it an essential debugging solution for multi-processor systems.

In this video, I provide a brief overview of how to quickly get started with the Active Pro Debugger and Logic Analyzer and run the included Demo. I walk you through the process of downloading the software from our website, installing it on your operating system, and running the application. I also demonstrate how to capture data and analyze it using the logic analyzer channels, firmware debug outputs, and analog channels.

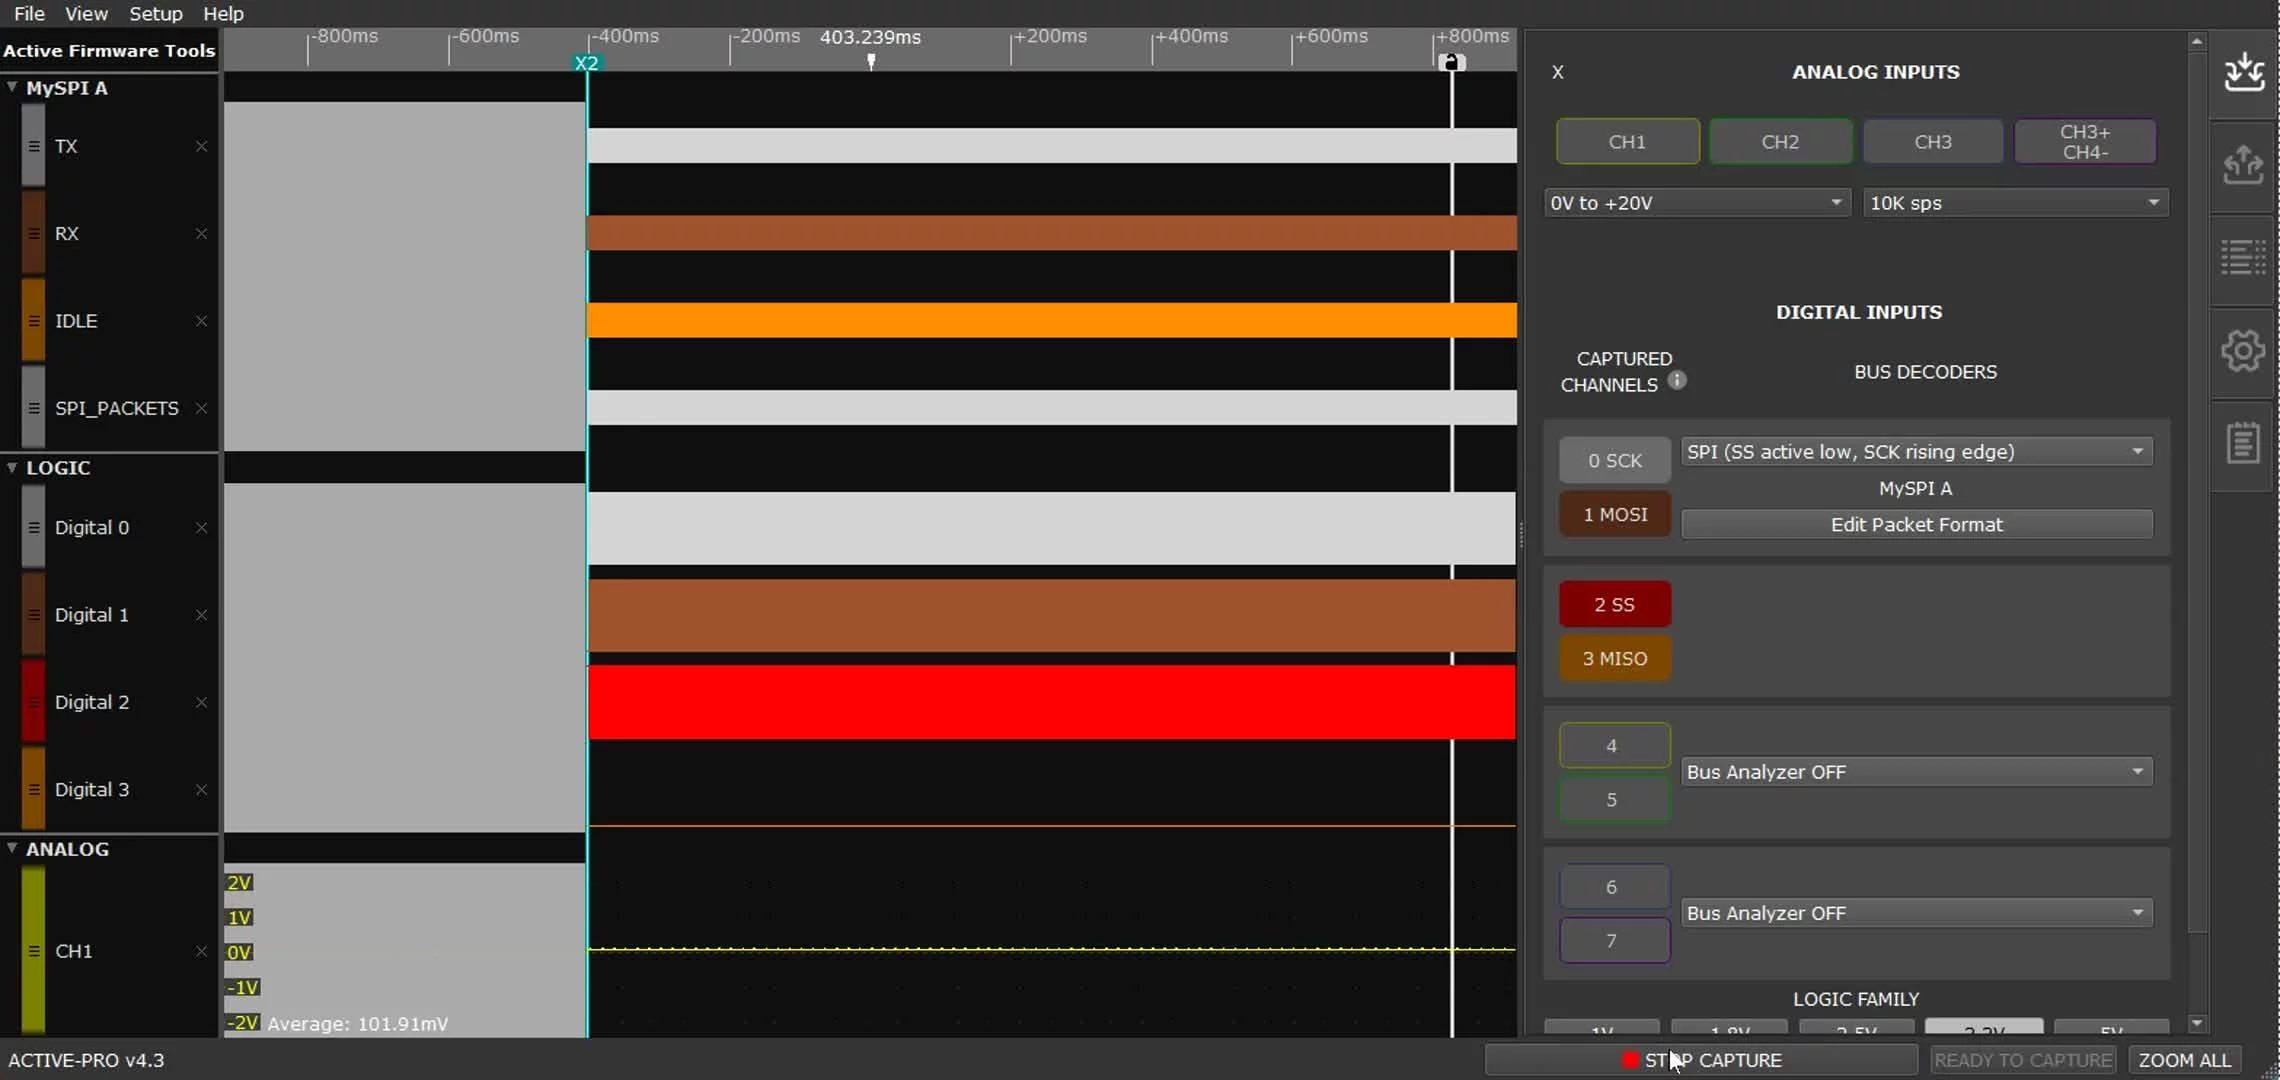
In this video, I'll show you the fastest way to capture I²C bus traffic. By running the Active-Pro application and connecting the SCL and SDA lines to the appropriate channels, we can easily capture and decode the I²C traffic. The captured data can be analyzed in real-time, and if further decoding is needed, we can stop the capture to get detailed information about each packet. No need to specify clock or data channels, the application will figure it out for you. Watch the video to learn more!

In this video, I will guide you through the process of setting up a firmware project from scratch using the Active Pro Debugger and Logic Analyzer. I will show you how to access the user's manual on our website, create the necessary header files, define the IOPINs, and configure the active init routine. I will also demonstrate how to send debug output and use virtual channels. This video will provide you with important information on how to debug your firmware effectively.
See how to quickly search and find the data that you need. Works for any bus, active debug data or packet presenter output.