

The Debugger Made for Embedded Systems Firmware and Hardware Engineers

See real-time firmware behavior across code, signals, and hardware - synchronized and visualized like never before.
Meet the
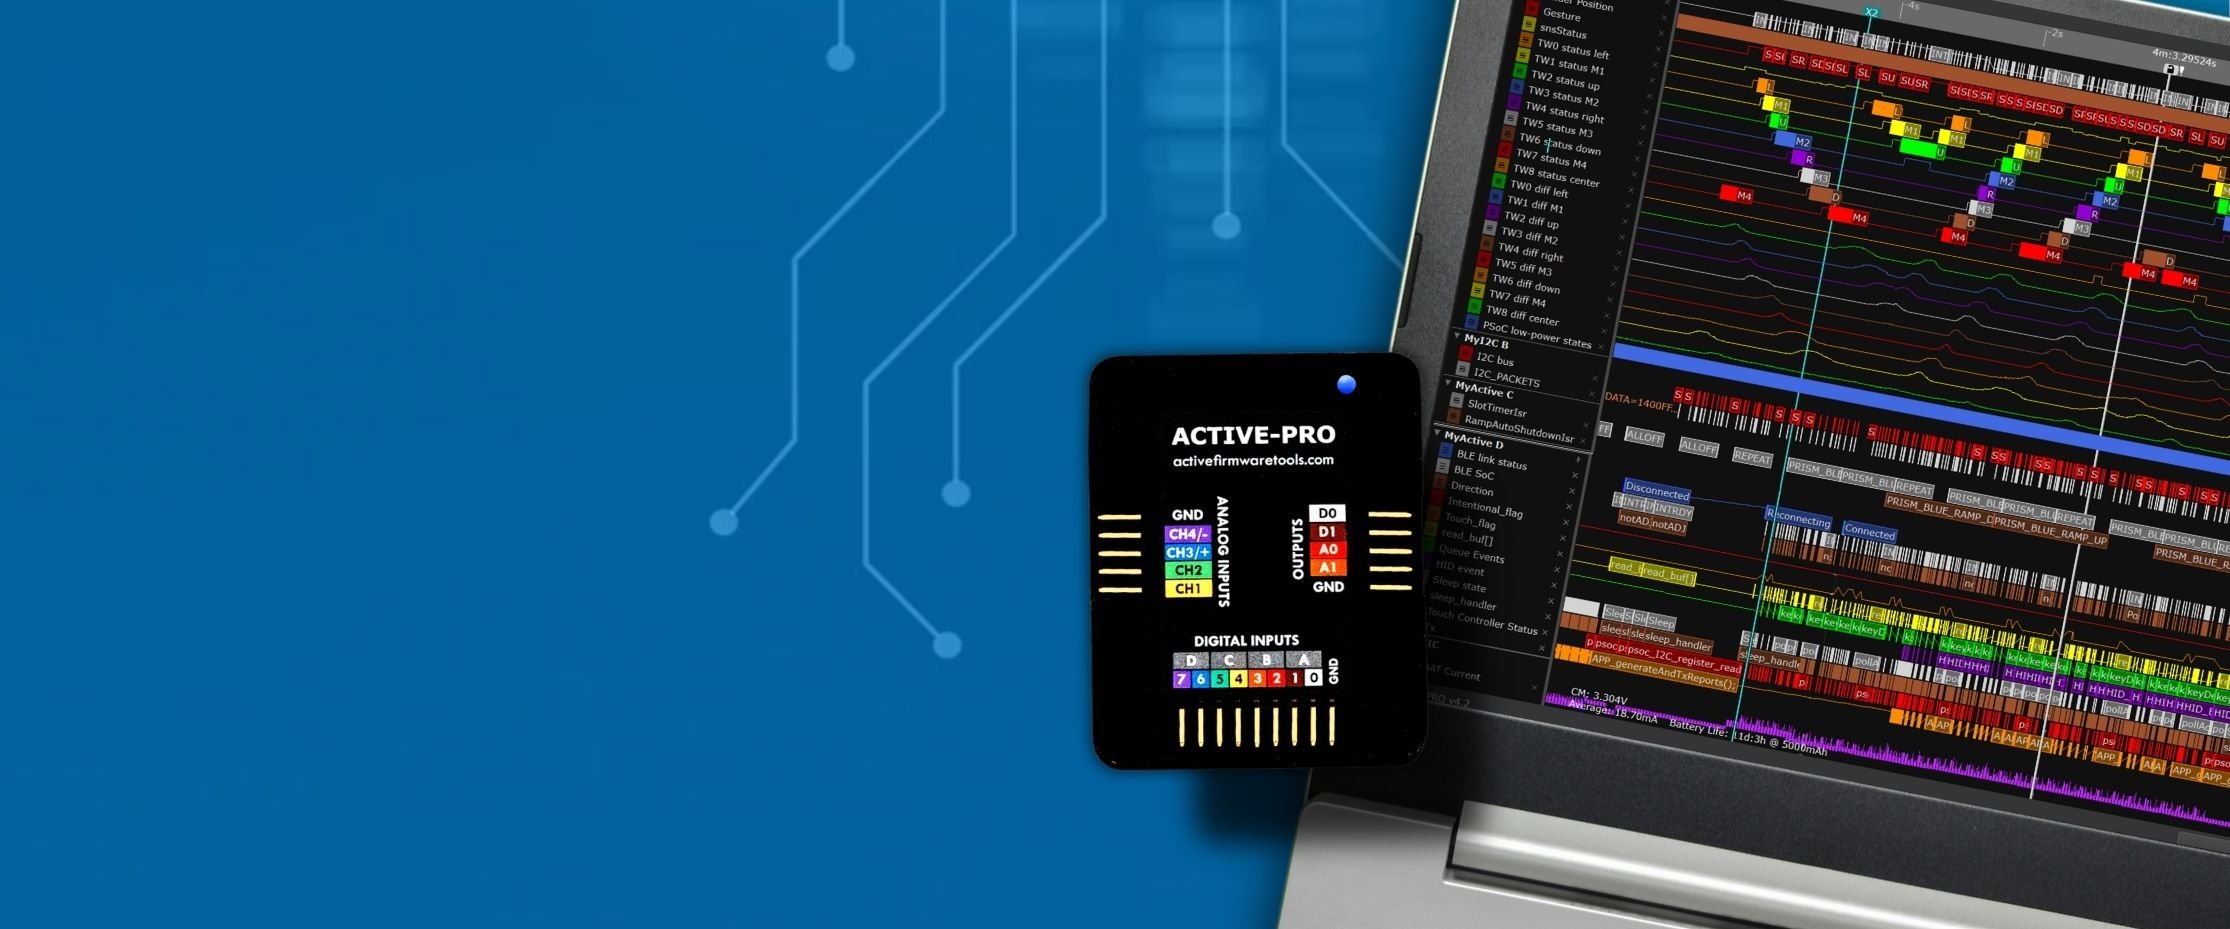
Active-Pro Debugger & Logic Analyzer
Active-Pro shows what your embedded system is actually doing: firmware debug output, timing, hardware signals, logic flow, decoded buses, and current, all in real time. It’s fast, easy to setup and use, and works beautifully across complex firmware, even when multiple processors or FPGAs are in the mix.
Debugging now at:

The Tool You'll Reach For First
Essential Data
Immediate Results
Complete View
Breakpoint-Free
Multi-CPU Debug
Any CPU or FPGA
Synchronized Firmware Variables, Debug Output and Hardware Signaling
Firmware debug output, transitions, states, hardware signals, and bus activity captured in sync, visualized live. Whether you're working on a single or multiple MCUs and FPGAs, it all lines up in one beautiful timeline.
Watch Live Debug Output
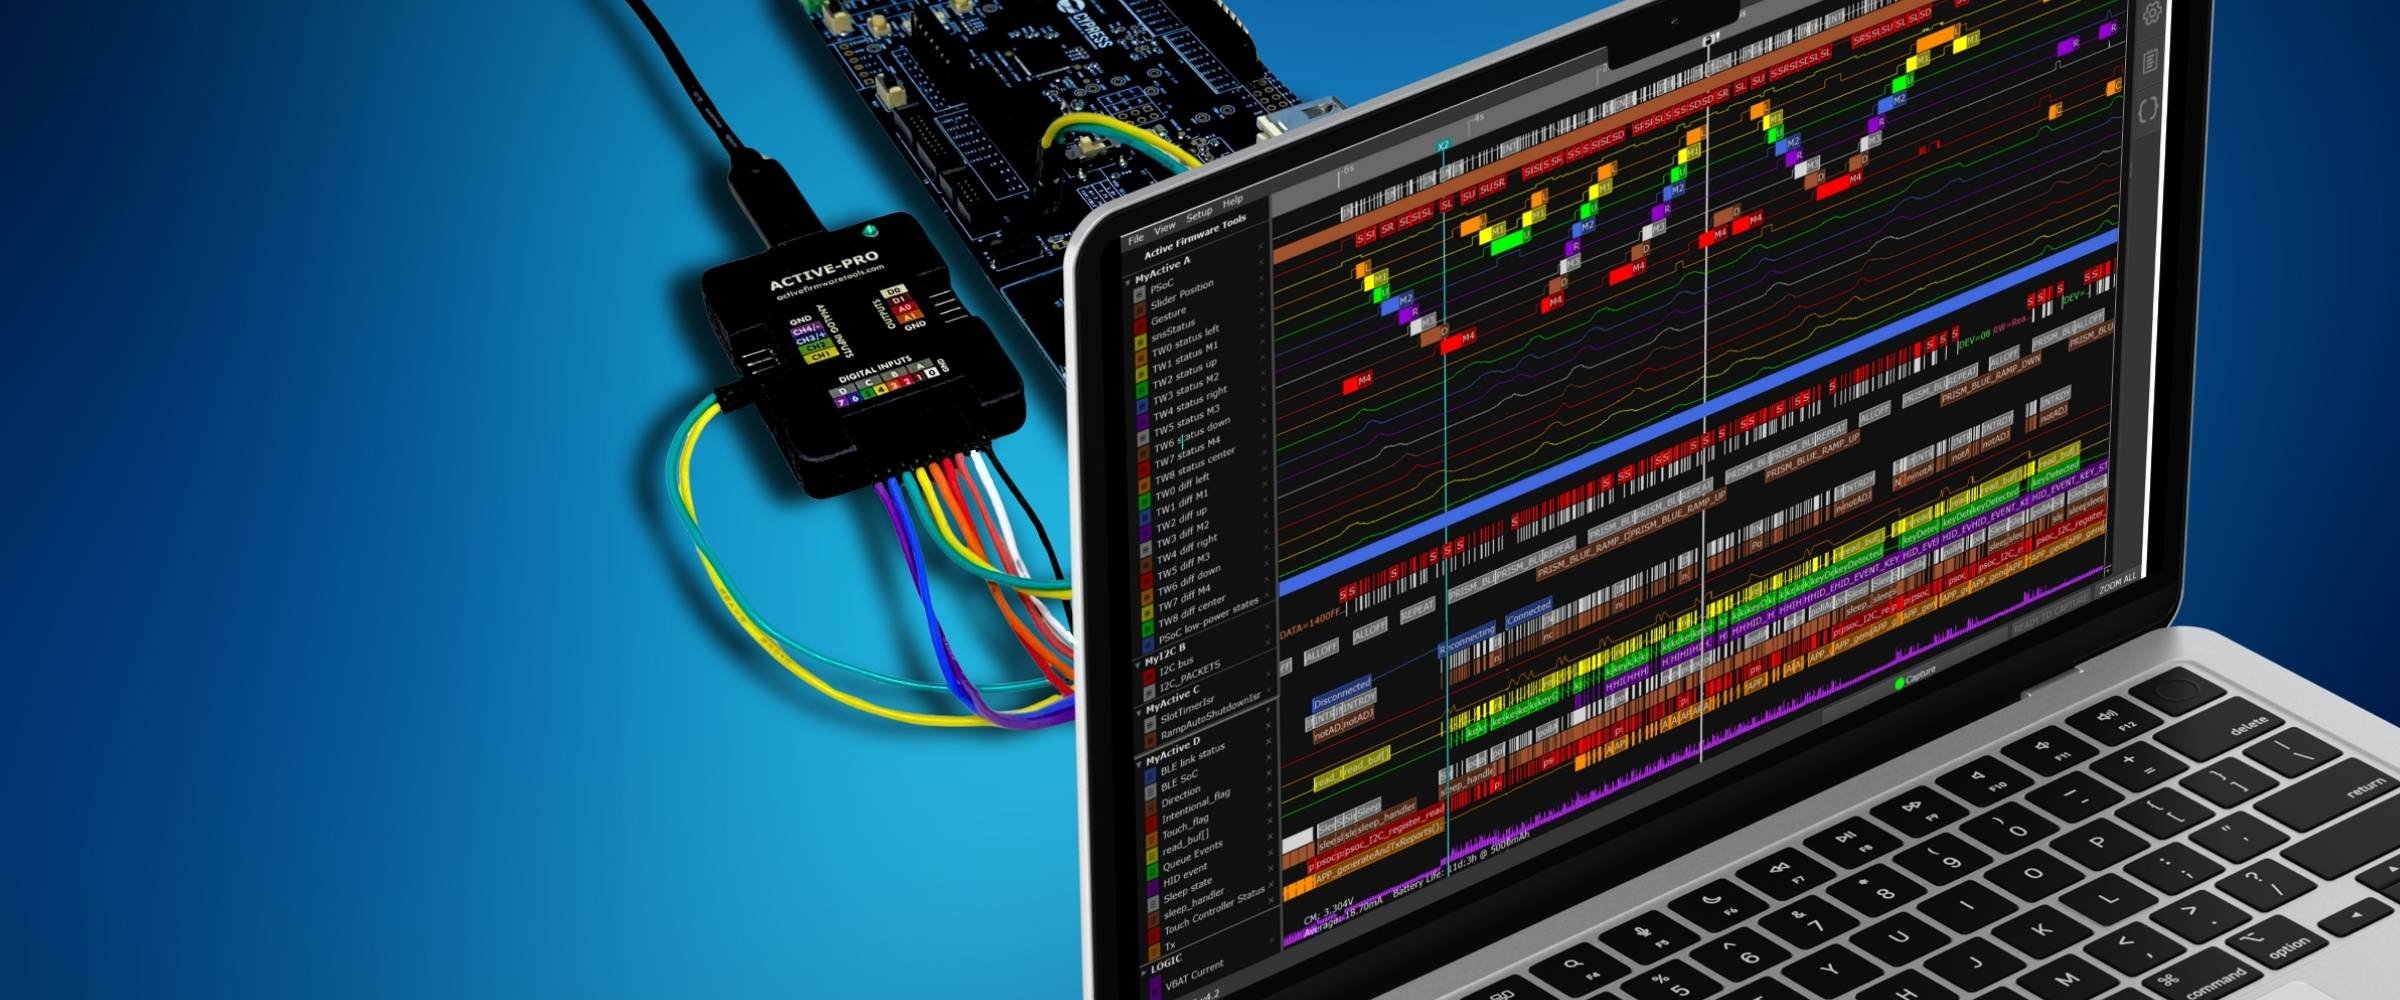
Viewing firmware debug output alongside hardware signals on a synchronized timeline shows exactly what your system is doing and when. You can instantly see the cause and effect between your code, I/O, and communication events, even across multiple processors, making deep firmware issues much faster to isolate and fix.
Go Inside Interprocessor Communications
The Active-Pro Debugger lets you see both sides of the communication, what's happening on the bus and what your firmware is doing to send and receive it. By combining external signal monitoring with internal trace points, it exposes issues between processors and FPGAs that traditional tools miss.
See Code Impacting Power Usage
The Active-Pro Debugger links source code to current changes during power mode transitions, so you can see exactly what code is running as power ramps up or down. It shows real-time power behavior, helping you tighten up power management code and improve reliability—especially in battery-powered systems.
Capture Real-Time Status Over Long Periods
The Active-Pro Debugger streams all data to disk so you can capture long test cycles without missing anything. While recording, it gives you a live view of system behavior and overlays multiple data streams for full context. It’s built for tough environments like automotive and aerospace, where catching rare issues fast matters.
Graph Algorithm Variables
The Active-Pro Debugger shows live internal variables as your algorithm runs, so you can focus on the actual computation, not just the outputs. It’s built to help you fine-tune sensor processing and troubleshoot issues fast by giving you a real-time view into what your code is doing.

Debug Multiple Processors and FPGAs Simultaneously


Instantly See the Data You Need
Instrument your Firmware

Analyze It Live

And See the Complete View
with Synchronized Analog and Digital Signals, Decoded Buses, and Current
-
"This is a fantastic tool. I wish I had this 20 years ago. I'm surprised no MSO or logic analyzer has this kind of capability. Kudos to you for developing this."
Phil Salisbury - Principal Engineer - Rimage Corporation

-
“With ACTIVE-Pro I was able to immediately find an issue with my multi-processor application... I love my ACTIVE-Pro firmware debugging tool!”
Troy Gentry - Field Applications Engineer - Infineon Technologies


Time to See What You’ve Been Missing
Buy the Active-Pro and finally get the insight your embedded firmware deserves.
One breakthrough bug fix and it pays for itself.
"“This tool is up there on my favorites list… so if you’re into hardware and firmware development, you must absolutely give this a try…”
VOLTLOG - YouTube Review