
AI Snapshot
AI Snapshot
The AI Snapshot feature exports a selected time range from your capture as a structured text block and copies it to the clipboard. Paste it directly into any AI assistant (ChatGPT, Claude, Gemini, or any other) and ask about your firmware's behavior, with your actual captured data as context, not a description of it from memory.
The Active Debug Port captures your firmware's internal state with nanosecond precision alongside hardware signals, hardware-decoded protocols, software-decoded protocols, and Custom Decoder annotations. An AI Snapshot packages all of those into a single structured block: every visible channel's events from the selected range, time-aligned and ready to hand off.
MCP Server: If you use Claude Desktop, the MCP Server takes this further. Claude can control the Active-Pro application directly, running captures, searching for specific events, and exporting snapshots, based on plain-English instructions. No copy-paste required.
What Gets Exported
The AI Snapshot collects all visible, enabled channels that have data within the selected time range and combines them into a single structured text block in chronological order. The format is the Active-Pro Firmware Trace (.aft) format.
The exported block contains:
- Header lines (always present):
Active-Pro Firmware Trace (.aft)
Timestamped firmware debug capture. Sources: embedded devices, logic, analog - interleaved chronologically. Analyze as a firmware engineer.
[ANALYSIS CONTEXT]section (only if the Notes-tab Analysis Context field is non-empty): your briefing text, included so the AI has context before seeing any data.[DEVICE SOURCES]section: one row per source that appears in the selected range, with the source code (A-Dfor device/Custom Decoder slots,ANfor analog,Lfor logic) and its label.[DEVICE X CHANNELS]sections: one section per device that produced data, listing the channels present and their per-channel labels.[LOGIC CHANNELS]section: present if any logic bit transitions were captured, lists each logic bit and its label.[ANALOG CHANNELS]section: present if any analog samples were captured, lists each analog channel and its label.---DATA---block: introduced by the literal line---DATA---, then the column headertimestamp, source, channel, data, then chronologically-sorted event rows.
If the export exceeds 100000 events, a [TRUNCATED: ...] notice is appended and the output is capped at that count. See the AFT File Format Reference section for details.
Data Included
- Active Debug Port channels: text strings (from
ACTIVEText/ACTIVEprintf) and numeric values (fromACTIVEValue) - Custom Decoder annotations: annotation rows emitted by attached Python decoders, appearing under the device slot the decoder is attached to
- PacketPresenter output: PP rows on visible PP channels within the range
- Logic channels: state transitions only, one row per bit transition (not every sample)
- Analog channels: one row per visible analog channel per analog sample within the range
Only sources/channels that have data and are visible (expanded) in the waveform display are included. Collapsing a device group, collapsing the logic group, collapsing the analog group, or hiding individual channels excludes them from the export.
Tip: Before taking a snapshot, hide any channels you do not need. Fewer channels means a smaller snapshot, which uses less of the AI's context window and keeps the analysis focused.
Taking a Snapshot
Step 1: Select a Time Range
Right-click and drag across the waveform to select the time range you want. A colored highlight appears over the selected region as you drag.
Alternatively, place X1 and X2 cursors and then right-click drag precisely between them, or use the same right-click drag technique in the List tab to select a range of decoded packet rows.
Step 2: Choose "Copy AI Snapshot"
Release the mouse button. A small menu appears with two options:
- Copy AI Snapshot (Ctrl+C)
- Copy Data (Ctrl+Shift+C)
Select Copy AI Snapshot.
Step 3: Confirmation
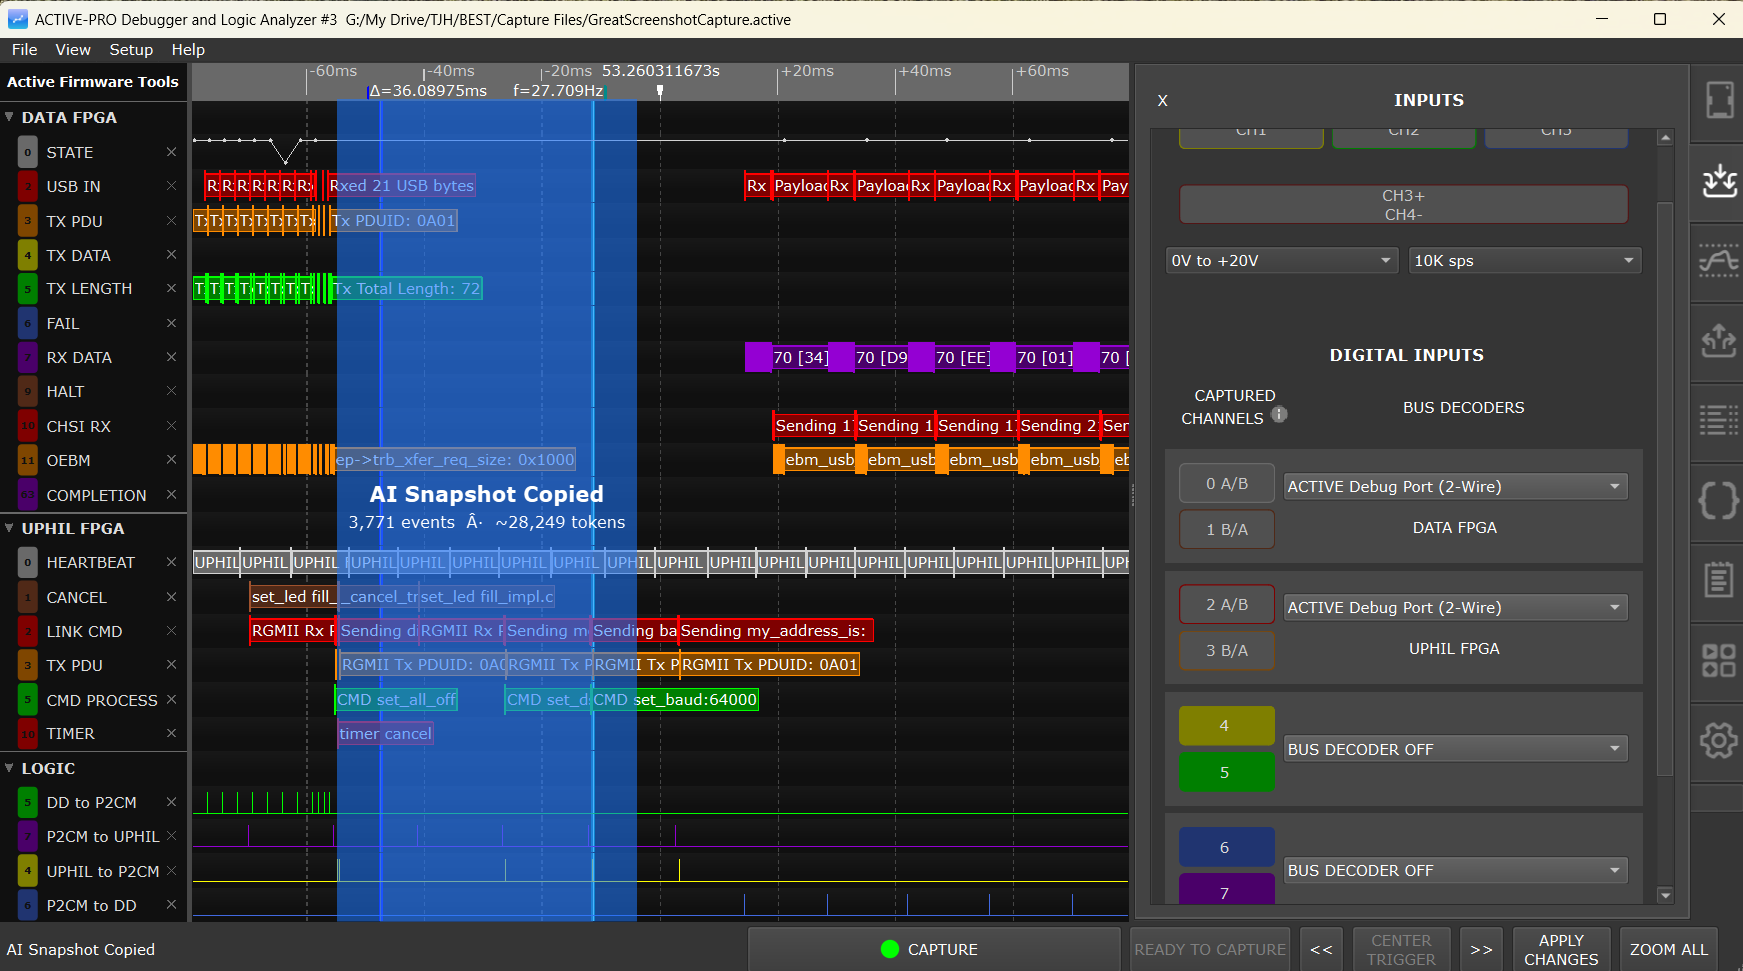
A brief on-screen toast appears with the title "AI Snapshot Copied" and a second line showing the event count and an estimated token count, in the form:
<N> events · ~<N> tokens
The status bar also briefly shows "AI Snapshot Copied".
If the token count is very high, consider narrowing your time selection or hiding additional channels to reduce it.
Step 4: Paste into Your AI Assistant
Switch to your AI assistant and paste (Ctrl+V). The AI will receive your firmware trace in full.
Tip: If you use Claude Desktop with the MCP Server installed, you can skip the copy-paste step entirely. Ask Claude to export an AI Snapshot directly to a file and analyze it in the same conversation.
Analysis Context
The Analysis Context field is in the Notes tab, below the rich text notes editor. It is a plain-text area where you write a briefing that appears at the top of every AI Snapshot exported from this capture file, before the AI sees any data.
A well-written Analysis Context makes AI responses significantly more useful. Rather than asking the AI to guess what your system is supposed to be doing, you tell it directly. Write what the firmware is supposed to be doing, what problem you are investigating, what question you want the AI to answer, and any relevant hardware or software context that is not visible in the trace data.
That context tells the AI what to look for. Without it, the AI is working from raw data alone.
If this field is left empty, the [ANALYSIS CONTEXT] section is omitted from the export entirely.
The Analysis Context is saved in the .active capture file, so it is restored when you reopen the file. This means you can document your investigation intent and it will always travel with the capture data.
You can also set the Analysis Context programmatically with the Automation API commands ClearAnalysisContext / AppendAnalysisContext, useful in automated test scripts where every snapshot should embed the test name, firmware version, and configuration without manual editing afterward.
AFT File Format Reference
The AI Snapshot writes a plain-text block in the Active-Pro Firmware Trace (.aft) format.
Header
The first two lines are always:
Active-Pro Firmware Trace (.aft)
Timestamped firmware debug capture. Sources: embedded devices, logic, analog - interleaved chronologically. Analyze as a firmware engineer.
Sections (in order)
[ANALYSIS CONTEXT](optional) - your briefing text from the Notes tab's Analysis Context field. Omitted entirely if the field is empty.[DEVICE SOURCES]- lists every source present in the selected range, one per line in the form<src>, <label>. The<src>codes are:
A/B/C/Dfor the four Active Debug Port / Custom Decoder slots (the<label>is the device name, orDevice Astyle fallback when unnamed)ANfor analog (label is alwaysANALOG)Lfor logic (label is alwaysLOGIC)
[DEVICE A CHANNELS],[DEVICE B CHANNELS], ... - one section per device that produced data, listing the per-channel<channel>, <label>rows.[LOGIC CHANNELS]- if any logic bits are present, one row per bit (<bit>, <label>).[ANALOG CHANNELS]- if any analog channels are present, one row per channel (<ch>, <label>). Analog channels are 1-based in this listing.
Data block
After the section headers, the literal line ---DATA--- introduces the chronological event rows. The next line is the column header:
timestamp, source, channel, dataEach event row is <timestamp>, <source>, <channel>, <data> where:
| Field | Meaning | |
|---|---|---|
timestamp |
Seconds, decimal, up to 9 fractional digits (trailing zeros stripped) | |
source |
A / B / C / D (device or Custom Decoder slot), AN (analog), or L (logic) |
|
channel |
Channel number within the source. For analog this is 1-based (CH1..CH8). For device and logic it is 0-based. | |
data |
Decoded string, numeric value, or logic bit (0 or 1). Quoted with "..." and inner " doubled if the value contains a comma. |
Truncation
If the selected range contains more than 100000 events, only the first 100000 are emitted and an extra line is appended:
[TRUNCATED: output limited to 100000 events. Narrow the cursor range to export all data.]Example output
Active-Pro Firmware Trace (.aft)
Timestamped firmware debug capture. Sources: embedded devices, logic, analog - interleaved chronologically. Analyze as a firmware engineer.

[ANALYSIS CONTEXT]
Investigating why the motor controller loses lock at high speed.
I2C bus on Device A is the control interface; Device B is the firmware debug output.

[DEVICE SOURCES]
A, I2C Bus
B, Motor Controller Debug
L, LOGIC

[DEVICE A CHANNELS]
0, I2C decoded

[DEVICE B CHANNELS]
0, speed_loop
1, phase_error
2, fault_state

[LOGIC CHANNELS]
0, RESET
3, ENABLE

---DATA---
timestamp, source, channel, data
0.000125100, A, 0, "W 0x28 0x03 0xFF"
0.000125900, B, 0, "speed_loop: target=4500 actual=4498"
0.000126400, B, 1, "phase_error: 0.3 deg"
0.000201000, A, 0, "R 0x28 0x01 -> 0x03"
0.000201500, B, 2, "fault_state: NONE"
0.000310200, L, 0, 1
Difference Between AI Snapshot and Copy Data
| Copy AI Snapshot | Copy Data | |||
|---|---|---|---|---|
| Format | AFT structured text (header, channel legend, analysis context, interleaved data) | Simpler CSV format | ||
| Intended use | Pasting into AI assistants | Pasting into spreadsheets or scripts | ||
| Channel legend | Included | Not included | ||
| Analysis context | Included | Not included | ||
| Custom Decoder devices | Listed in [DEVICE SOURCES] with the decoder's name |
Decoder annotations appear as rows but with no separate header | ||
| Shortcut | Ctrl+C (in context menu) | Ctrl+Shift+C (in context menu) |
See Export for more details on Copy Data and CSV export.