 Image 1 of 5
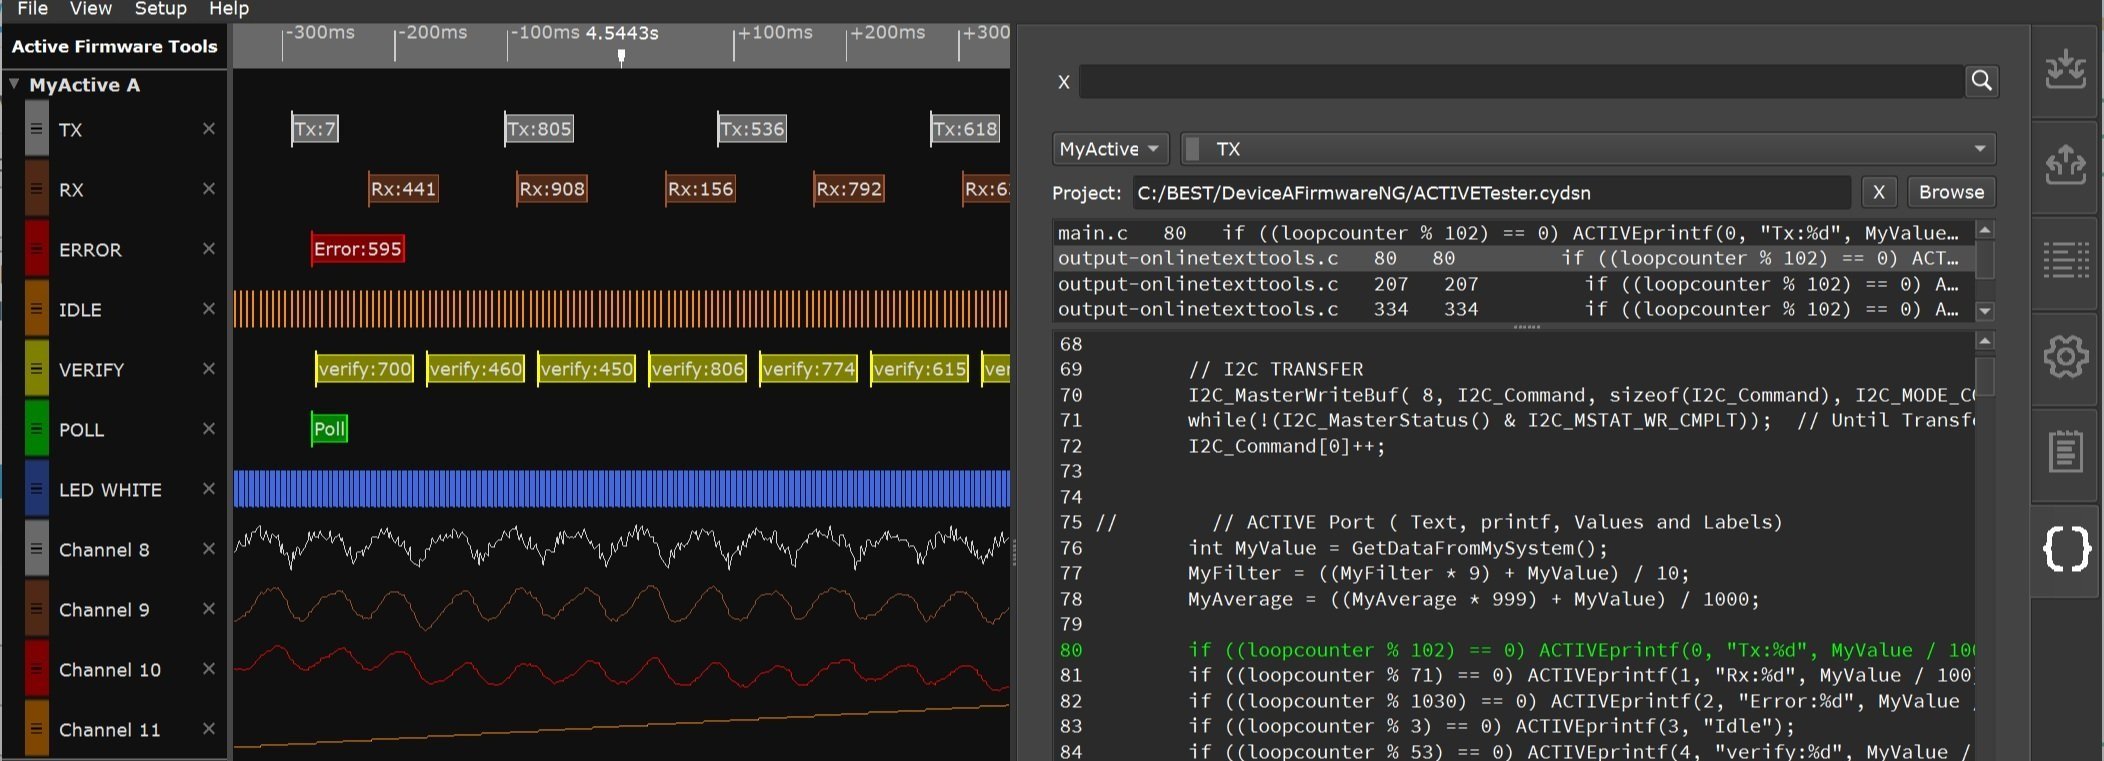 Image 2 of 5
 Image 3 of 5
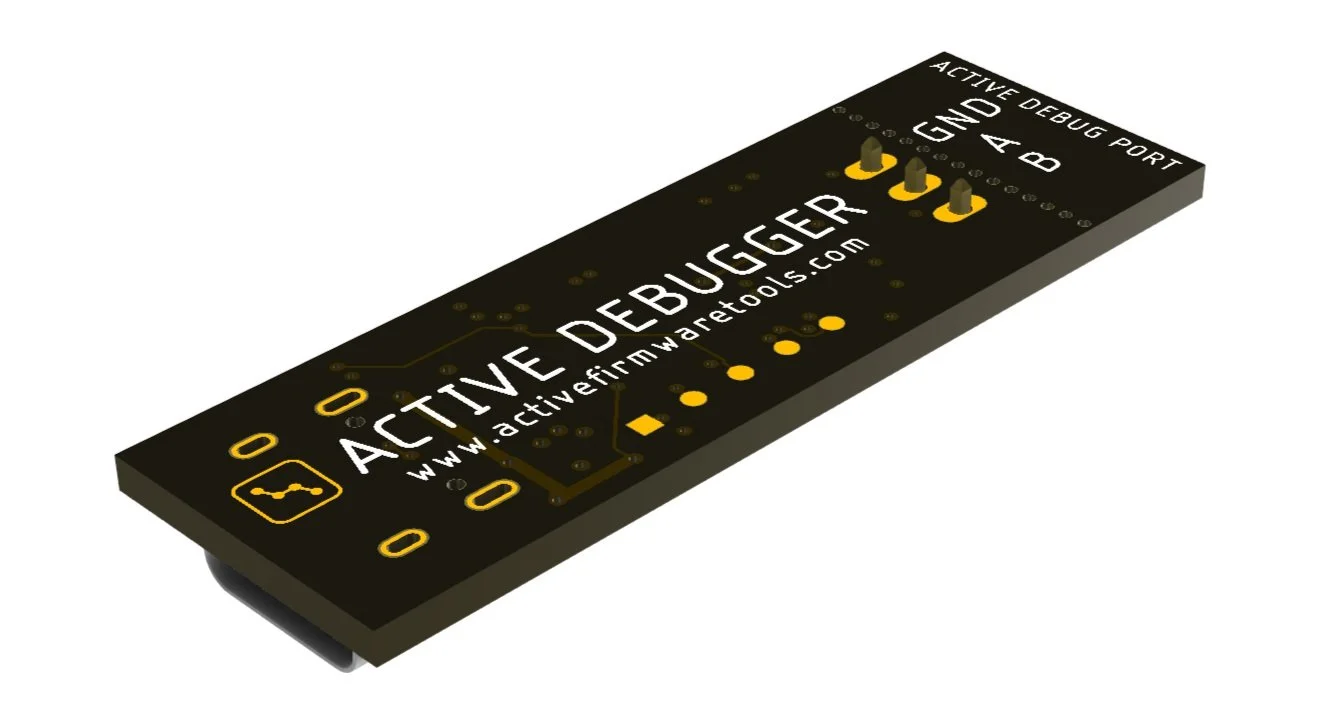 Image 4 of 5
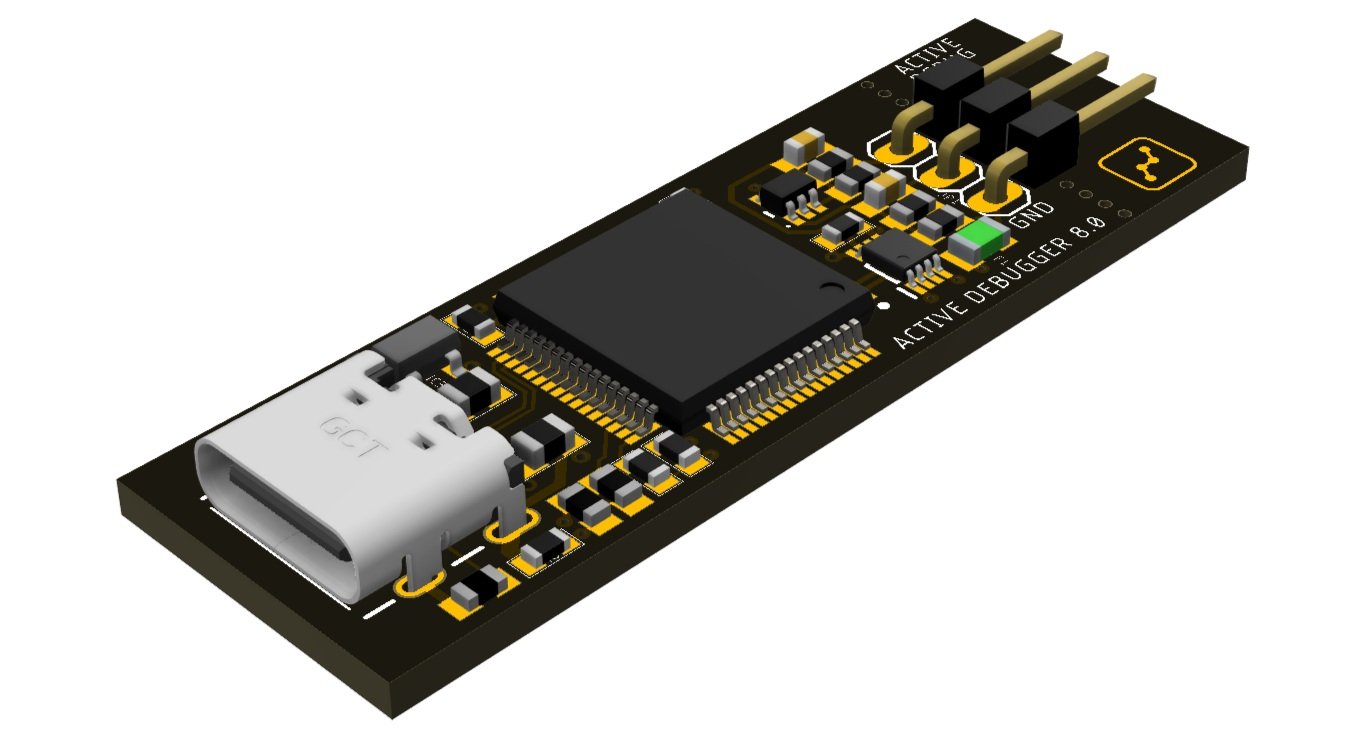 Image 5 of 5
Key Benefits:
You & Your AI can Debug Processors or FPGAs
See What Your Firmware is Doing in Real-Time
Capture Variables, States, Logic, Analog, Decoded Busses, and Debug Output on Multiple Channels
Automatically Graph Internal Variables
Trace Events to Source Code
Automatic Setup for Fast Debug Cycles
Nanosecond Timestamp Accuracy
Use on Any Processor or FPGA
Key Features:
AI Snapshot Export: Select any region of your capture, press Ctrl+C, and a plain-text trace lands on your clipboard in .aft format. Paste it straight into Claude, ChatGPT, Gemini, or any AI chat and ask questions about what your firmware and hardware did. No screenshots, no files to upload.
MCP Server: Connect Claude Desktop and let the AI operate the instrument directly. Start and stop captures, search decoded data, drive outputs, and save files from plain-English instructions, with more than 40 tools covering the full Automation API.
Active Debug Port: Output real-time debug data—variables, state changes, and custom messages—directly to the software without stopping execution. Messages link to the exact source code lines that generated them, giving you a clear, time-correlated view alongside waveforms, protocols, and current measurements.
Real-Time Variable Graphing: Visualize firmware variables as they change dynamically, providing immediate, actionable insights into system behavior.
Automatic Packet Field Decoder: Easily analyze standard and proprietary communication protocols with Packet Presenter, which automates field decoding and simplifies complex data streams.
Automation API: Integrate the Active-Pro into your custom workflows with scripting support for automated testing and analysis.
Data Exporting: Export captured waveforms, debug logs, and decoded protocol data in multiple formats to document findings or integrate results into other tools.
The Active Debugger combines all these capabilities into a single, streamlined device, making it easy to debug microcontrollers, FPGAs, and other embedded systems. By reducing the need for separate tools, it speeds up troubleshooting, simplifies complex workflows, and helps you get to the root of your problems faster.
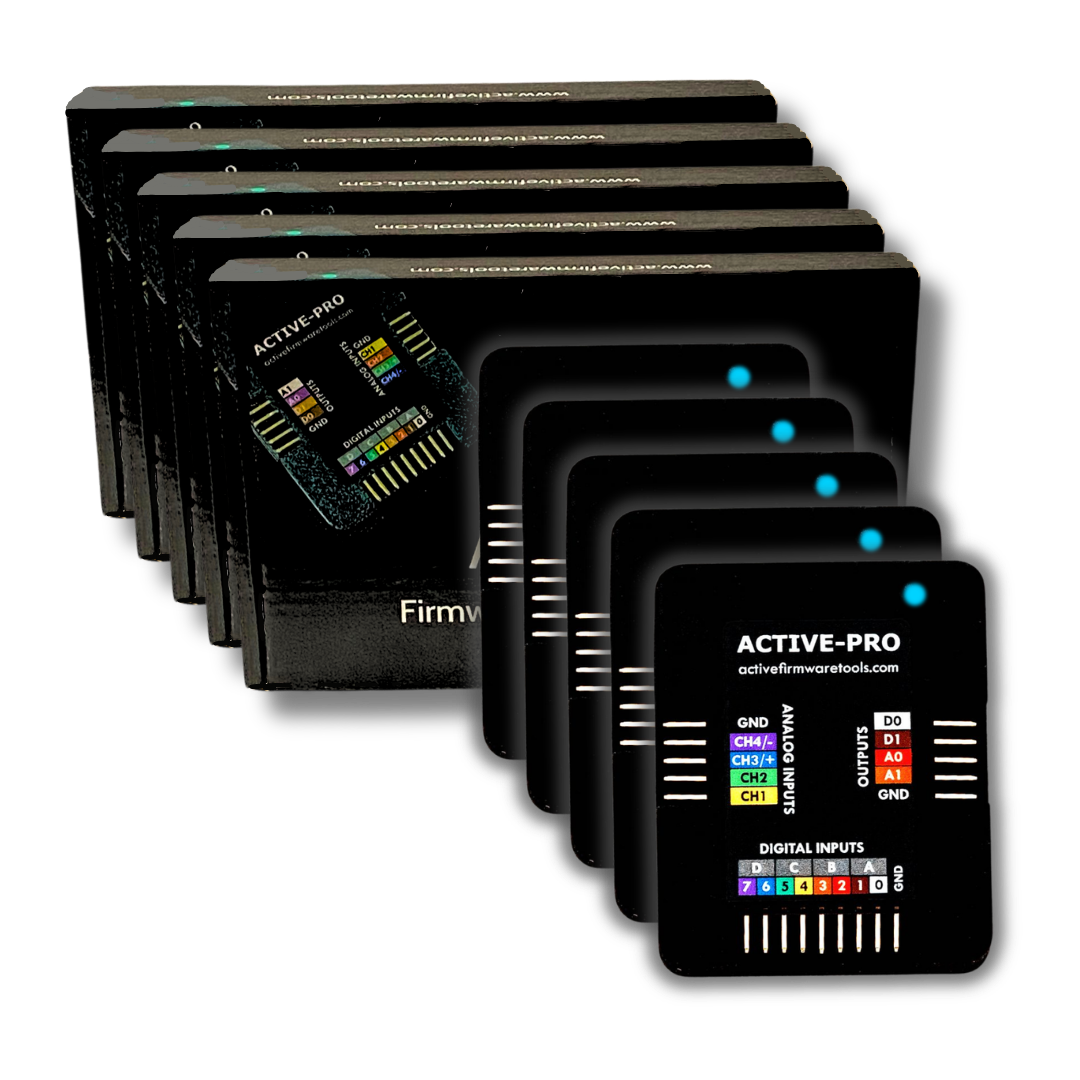
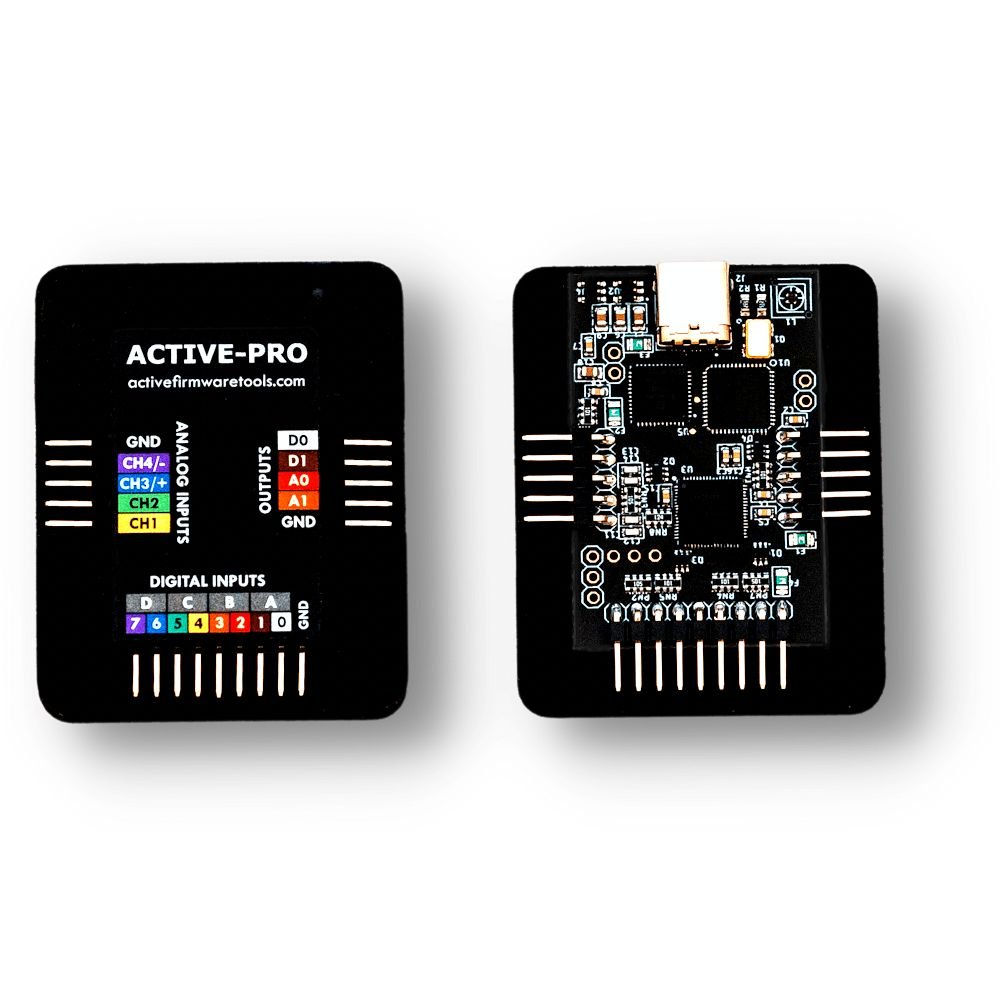
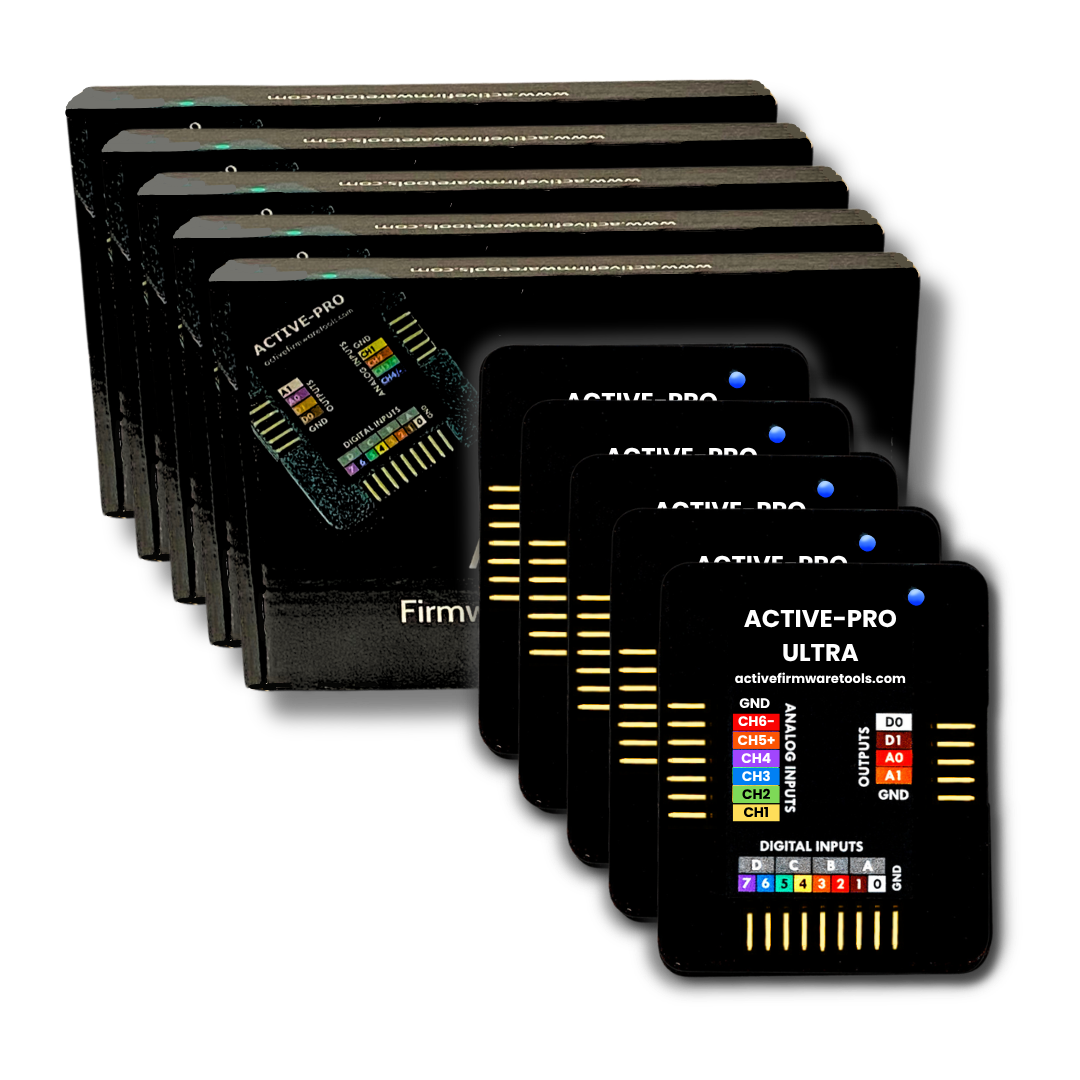
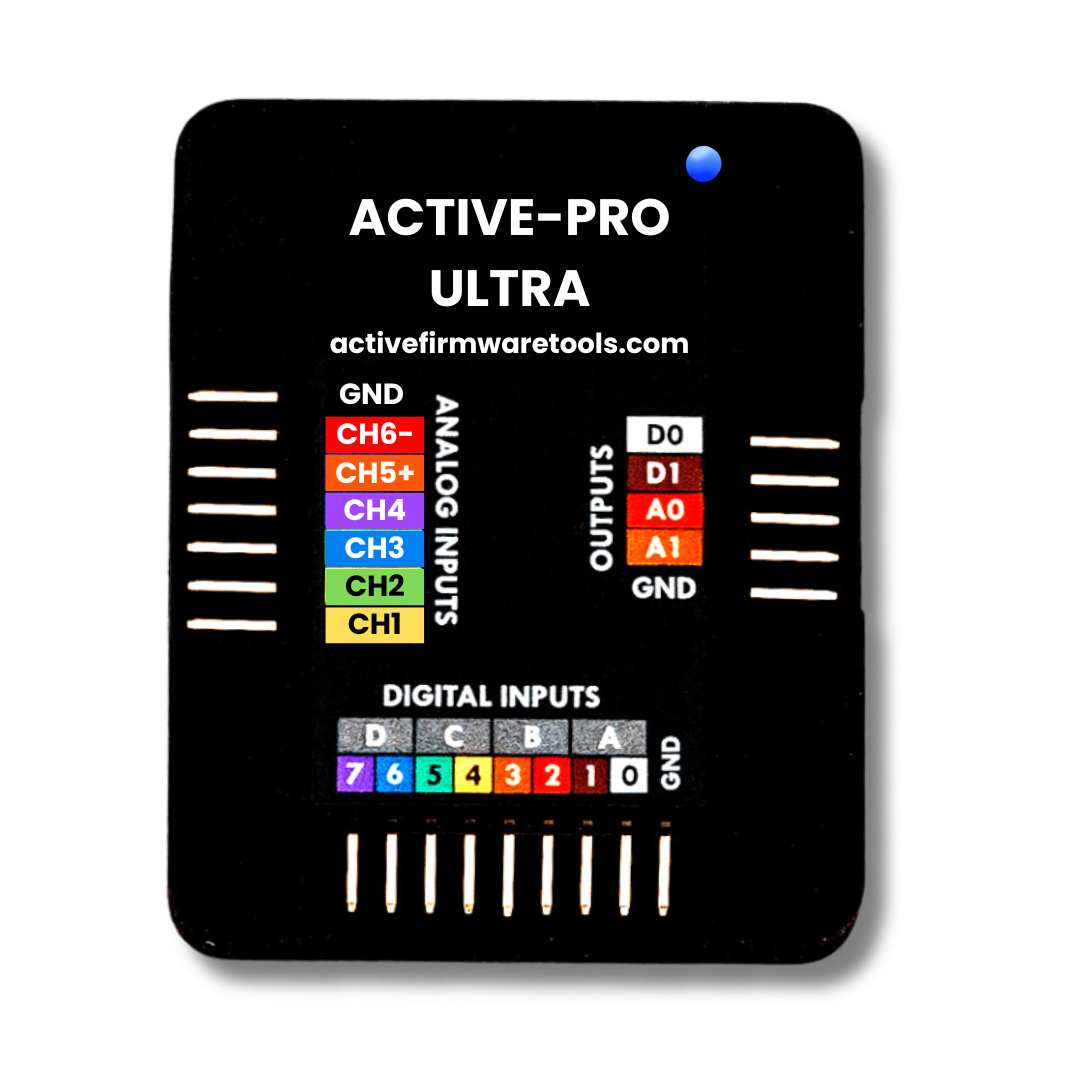
Digital Inputs
Sample Buffer Depth (limited only by disk size): > 4 Trillion
Digital Channels: 2
Fastest Active Debug Port Clock: 14MHz
Digital Logic Families Supported: 1V to 5V variable
Digital Input Voltage Range: -20V to 20V
Digital Input Impedance: 200K || 10pf
Sample Compression: Proprietary Lossless Compression
ACTIVE Debugger
Active Devices monitored simultaneously: 1
Active Debug Pins Per Device: 2 (Clock and Data)
Active Variables graphed per device: 64
Active Debug Channels per device: 64
Firmware Control of Active-Pro App: Capture Start and Stop, Beep, Screen Capture and Capture Save
Debug Message Timestamp Resolution: 8.3ns
Accessories Included
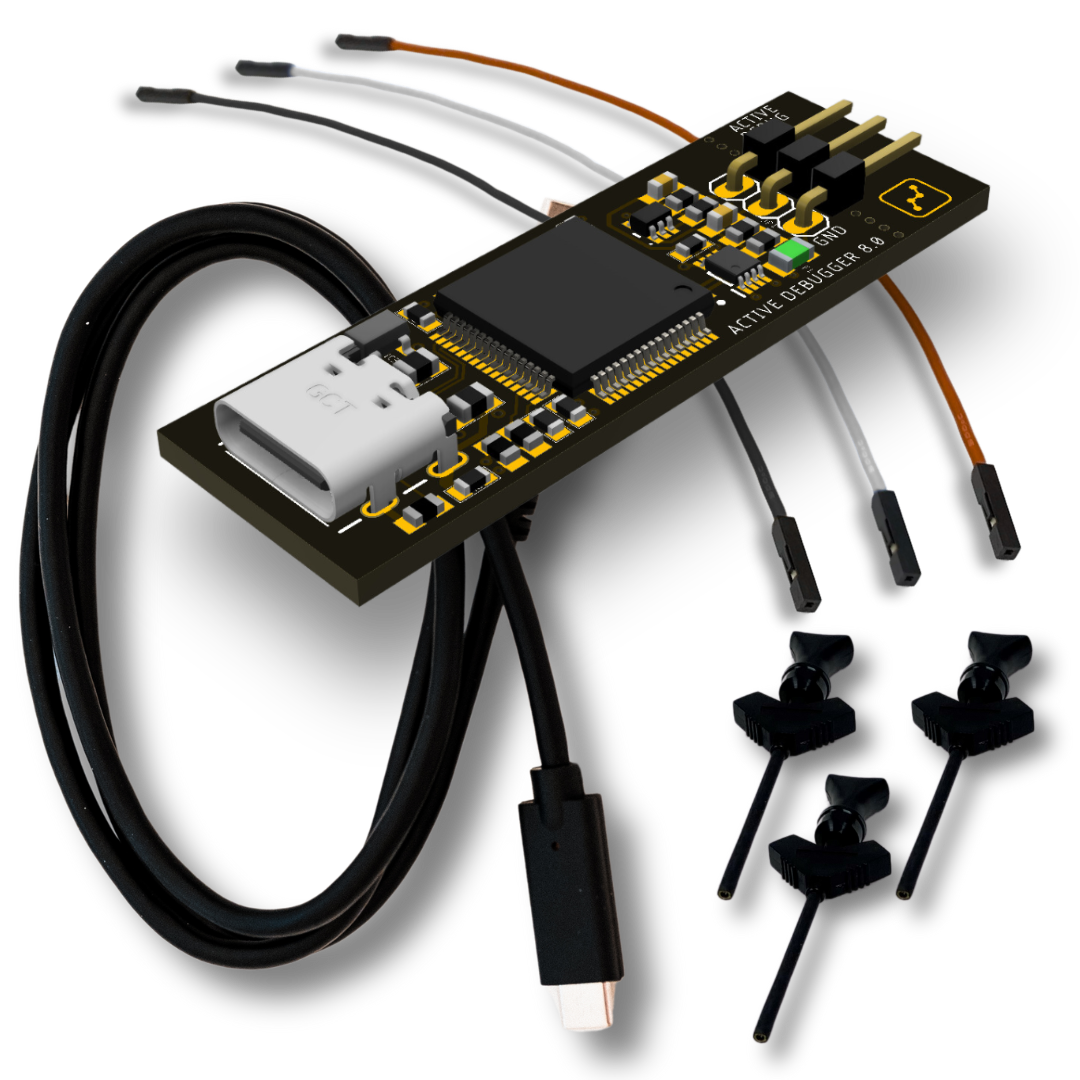
Test Leads: 3
Test Clips: 3
USB-C Cable
Physical
Size: 0.6" x 1.8" x 0.25"
Weight: 0.2 oz
PC Connection and Power
Windows, Mac and Linux
Connection and Power: USB-C
Connection Throughput: 12Mbps
Power Consumption: 20 mA at full throttle
Data Capture: Stream directly to disk
Overcurrent Protection: Resettable Polyfuse
What You Get:
Active Debugger
Active-Pro Software Application (Windows, Mac, Linux)
USB Cable (USB-A to USB-C), 3-foot
3 Test Clips and Color-Coded Leads
1-year Warranty
30-day Money Back Guarantee