
Overview
ACTIVE-PRO Debugger — User's Manual
The Active-PRO Debugger is a professional-grade embedded firmware debugging and bus analysis tool built for engineers who write firmware. It connects to Active Firmware Tools hardware over USB and captures, decodes, and displays data from your running microprocessor or FPGA in real time — without halting execution, without JTAG, and without modifying your build system in any meaningful way.
Contact Sales and Support:
Email: support@activefirmwaretools.com
The Active Firmware Tools Product Family
The Active Firmware Tools product family provides real-time firmware instrumentation that runs alongside your code without stopping it. Firmware execution, hardware signals, and power are all time-aligned in a single capture. You see the cause and effect between your code, I/O, and communication events without halting either the firmware or the hardware it's running on.
All three products use the same Active-Pro software and the same Active Debug Port interface. What differentiates them is the scope of hardware measurement you need alongside your firmware debug output.
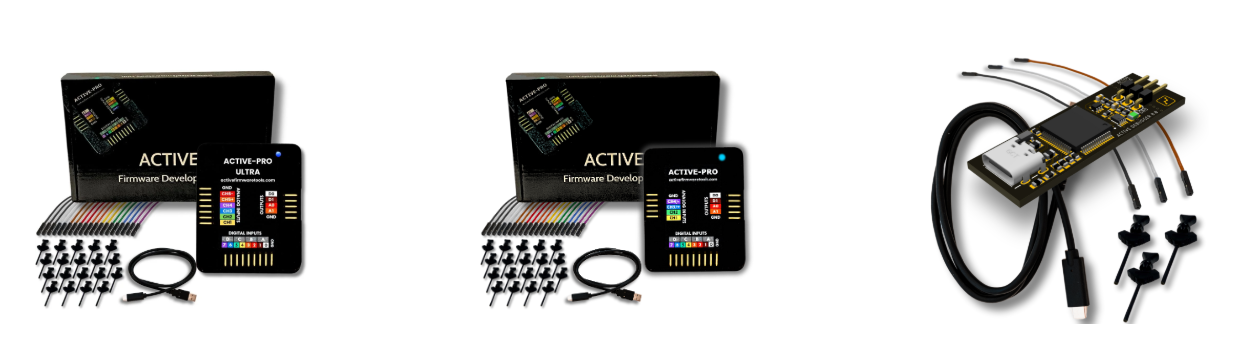
Active-Pro Ultra
Active-Pro
Active Debugger
What This Tool Does
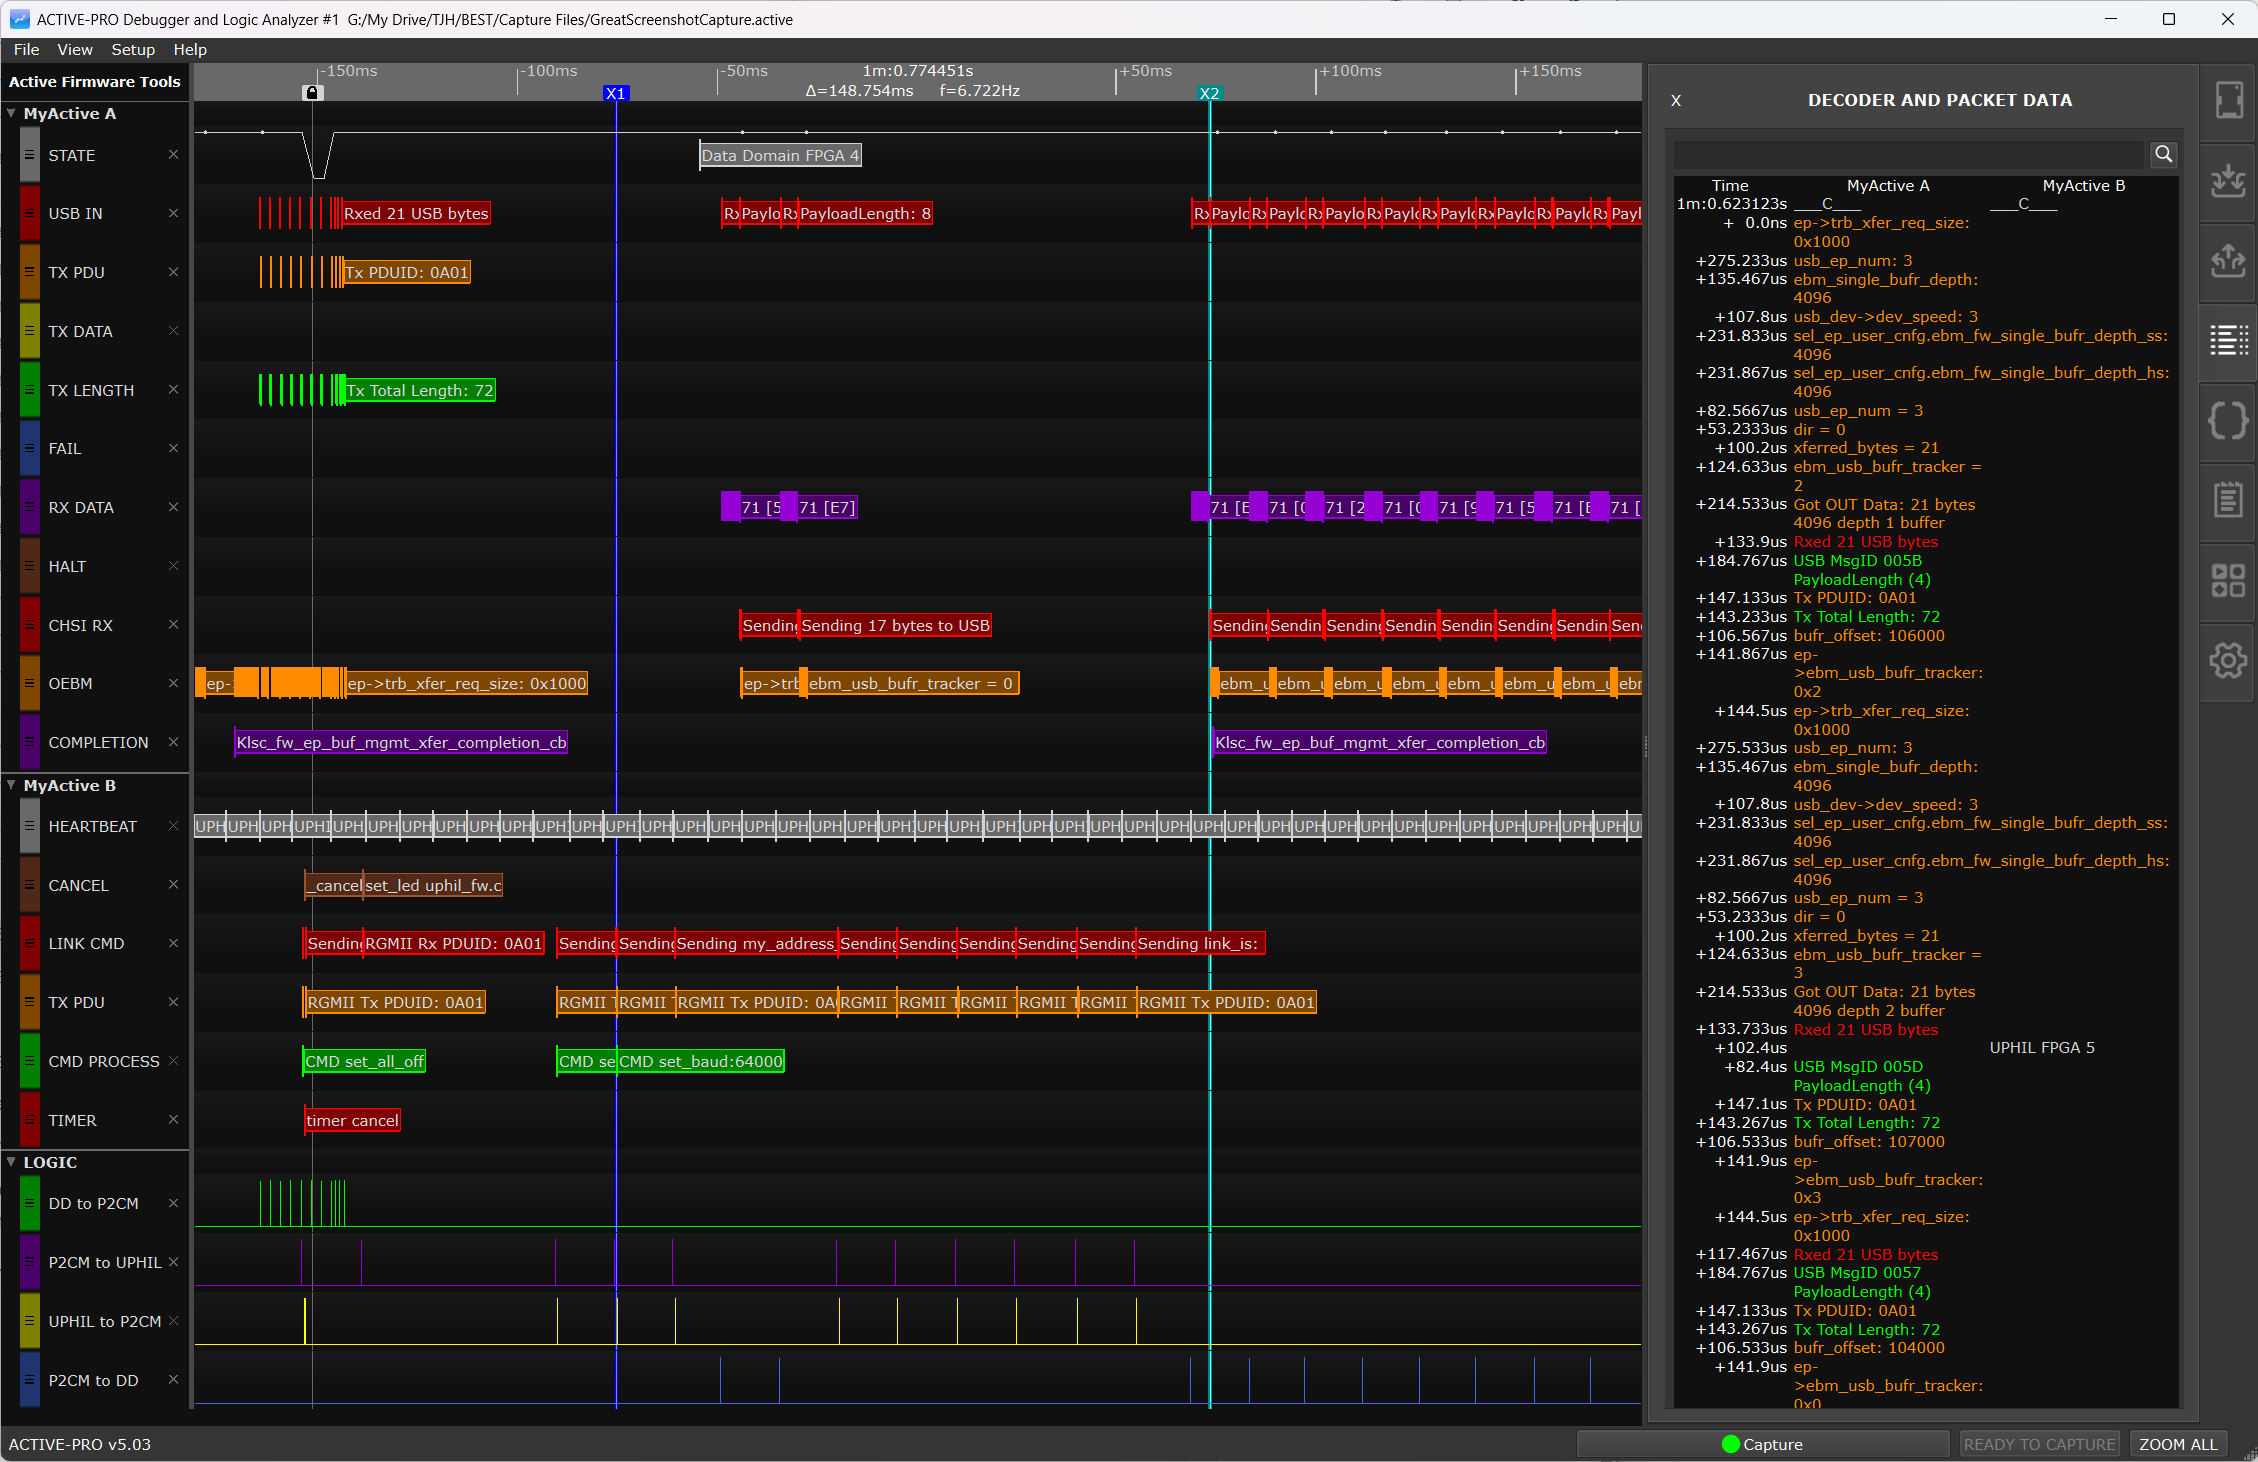
The ACTIVE-PRO software captures data from a connected hardware pod and displays it on a unified time axis. Depending on which hardware model you have, the display can include:
- Active Debug Ports (streaming live debug data from microprocessors or FPGAs) — printf-style text, variable values, and named channels sent directly from your firmware in real time, with nanosecond timestamp resolution
- Logic analyzer channels — 8 digital input channels showing binary waveforms at up to 500 Msps
- Analog oscilloscope channels — voltage waveforms at up to 50 Msps, 12-bit resolution
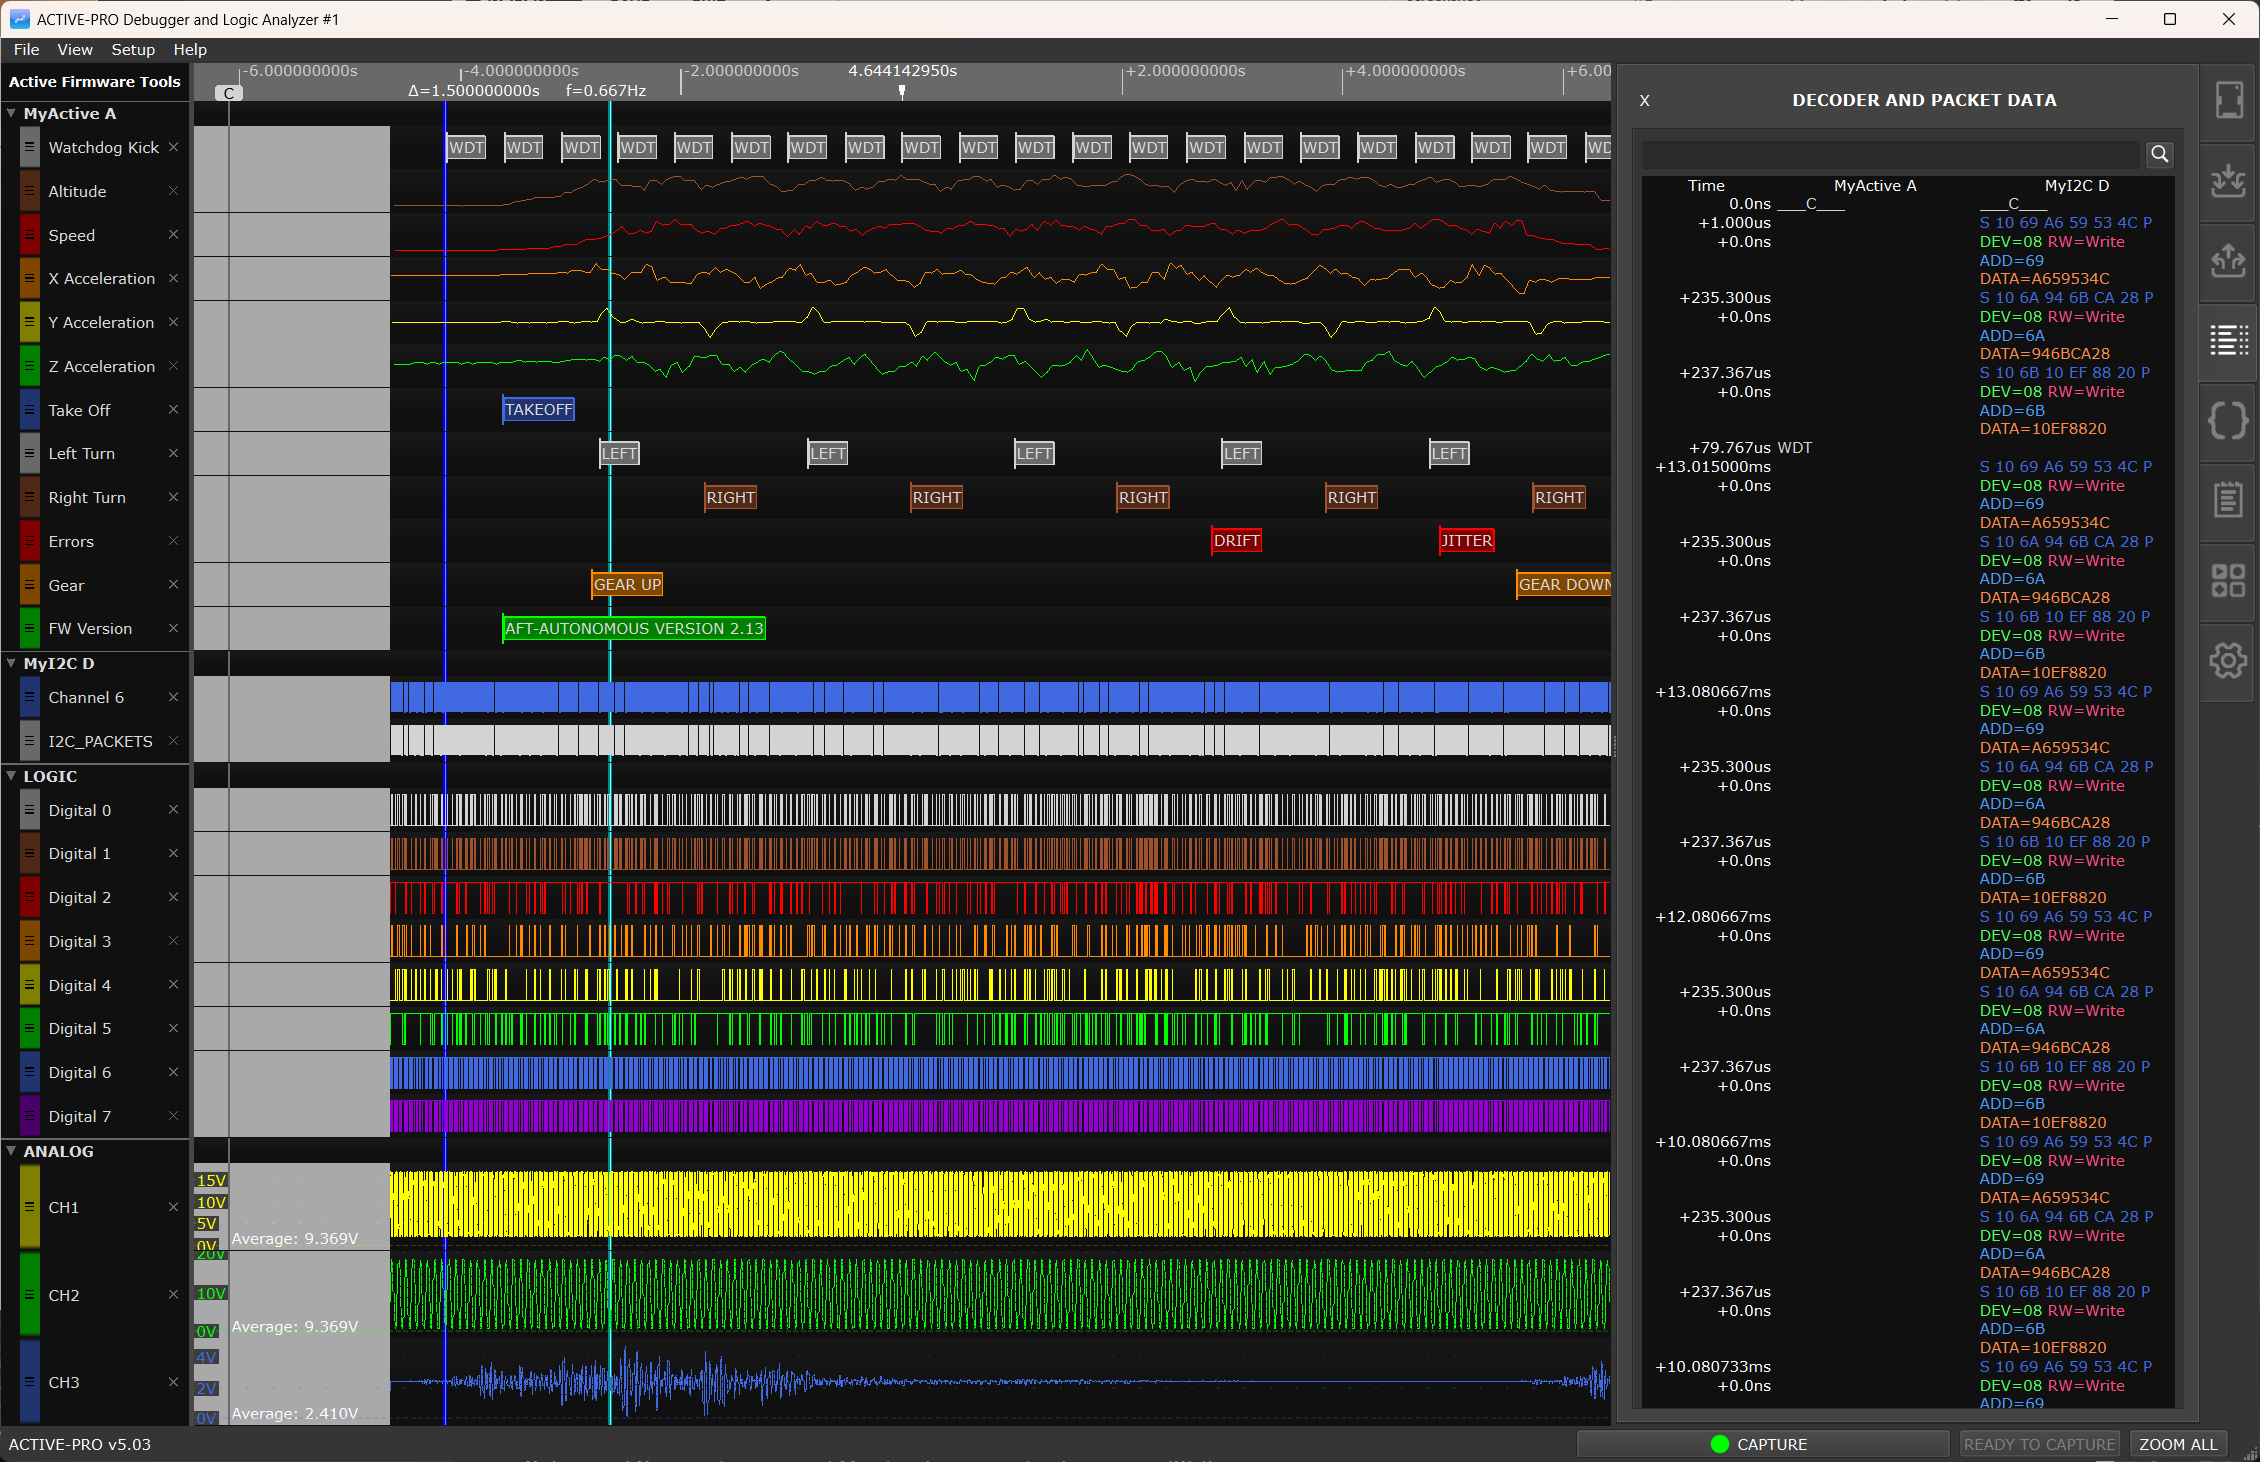
- Protocol decoded bus traffic — I2C, SPI, UART, LIN, RS-232, 1-Wire, MDIO, CHSI, and more, all time-correlated to the above
All streams share a single time base. You can see your firmware's printf output, an I2C transaction on the bus, and the analog voltage on a supply rail — all lined up on the same timeline, to nanosecond resolution.
The built-in PacketPresenter engine lets you define your own packet structure on top of any decoded byte stream — turning raw bytes into labeled fields with automatic graphing of numeric values.
On ACTIVE-PRO and ACTIVE-PRO Ultra hardware, the device can also generate digital and analog output signals under software control from your PC.
Hardware Models Covered in This Guide
This guide covers three hardware models, The Active-Pro Ultra, the Active-Pro, and the Active Debugger
Active Debugger
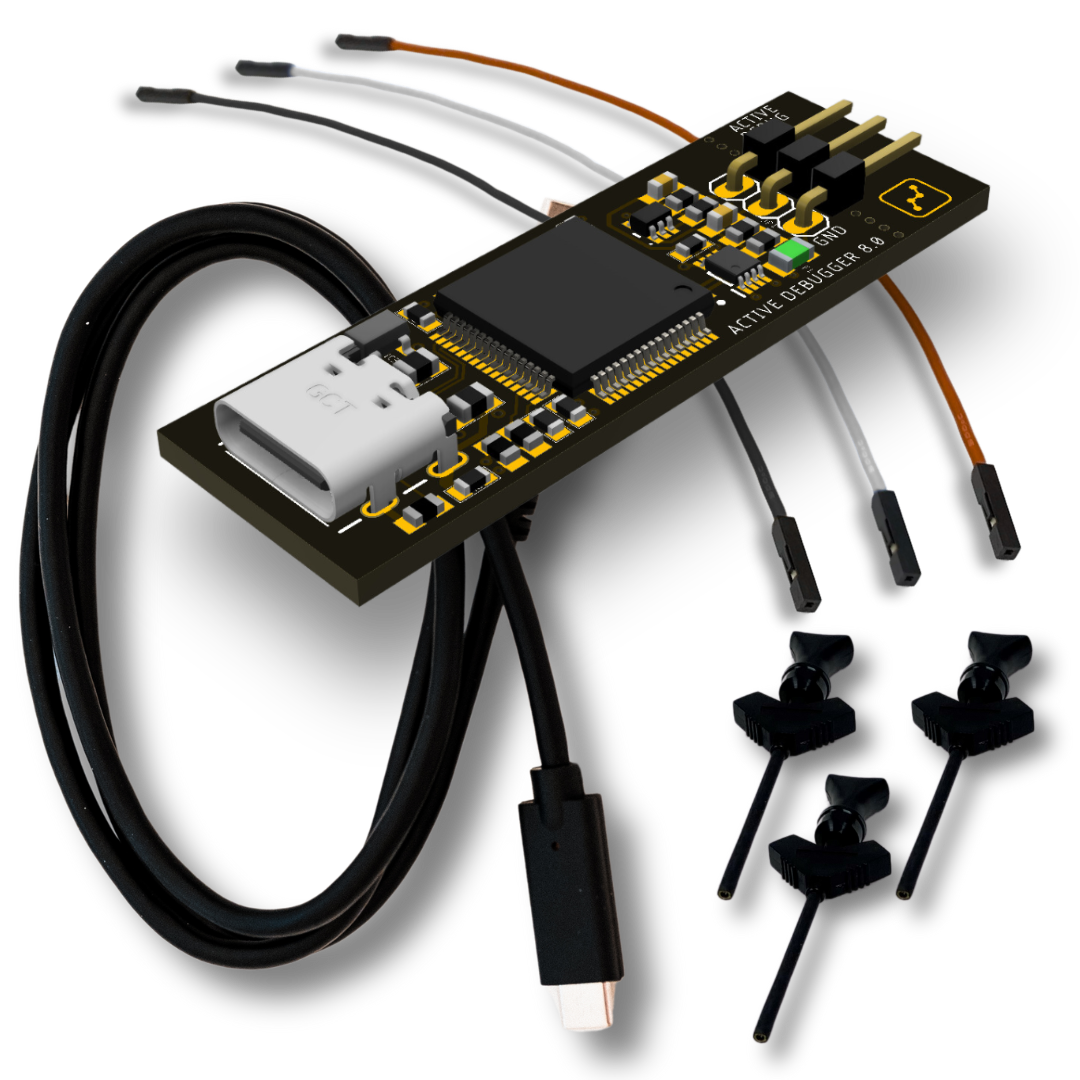
The Active Debugger is a compact, ultra-low-cost firmware debug pod. Two signal pins connect to your microprocessor or FPGA and stream live debug output directly to the PC. If your only goal is getting printf-style visibility into your running firmware — with accurate timestamps and without halting execution — this is the tool for that.
| Specification | Value |
|---|---|
| Active Debug Ports | 1 (port A only) |
| Debug port max clock | 14 MHz |
| Debug channels per port | 64 |
| Graphable variables per port | 64 |
| Timestamp resolution | 1 ns |
| Input voltage range | −20 V to +20 V |
| Logic family support | 1 V to 5 V |
| Input impedance | 200 kΩ ∥ 10 pF |
| USB interface | Full-Speed (12 Mbps), USB-C |
| Power draw | 20 mA max |
| Dimensions | 0.6" × 1.8" × 0.25" |
| Weight | 0.2 oz |
| Included accessories | 3 test clips and color-coded leads |
ACTIVE-PRO

The ACTIVE-PRO is the full-capability instrument. It combines a logic analyzer, analog oscilloscope, firmware debugger, protocol decoder, and signal generator in a package the size of a thumb drive. Four Active Debug Ports let you monitor four separate processors or FPGAs simultaneously on the same timeline.
| Specification | Value |
|---|---|
| Active Debug Ports | 4 (A, B, C, D) |
| Debug channels per port | 64 |
| Graphable variables per port | 64 |
| Timestamp resolution | 1 ns |
| Logic Inputs | |
| Digital channels | 8 (D0–D7) |
| Logic sample rate | 120 Msps (waveform traces) / 240 Msps (hardware decoders) |
| Max measurable frequency | 60 MHz |
| Input voltage range | −0.5 V to 6 V |
| Logic family support | 1 V to 5 V |
| Input impedance | 1 MΩ ∥ 10 pF |
| Analog Inputs | |
| Analog channels | 3 (single-ended), or 2 single-ended + 1 differential |
| Single-ended sample rate | 1 Msps, 12-bit |
| Single-ended voltage range | 0 V to 20 V or −10 V to +10 V |
| Differential sample rate | 200 Ksps, 15-bit |
| Differential voltage range | ±2 V |
| Analog input tolerance | −30 V to +30 V |
| Digital Outputs | |
| Digital output channels | 2 (D0, D1) |
| Output levels | 0 V, 3.3 V, tri-state |
| PWM | 0–100% duty cycle at 250 kHz; 8 mA max drive |
| Analog Outputs | |
| Analog output channels | 2 (A0, A1) |
| DC output range | 0 V to 3.3 V variable, tri-state |
| Waveform types | Sine, ramp, triangle, square |
| Waveform frequency range | 62.5 Hz to 25 kHz |
| Connectivity | |
| USB interface | High-Speed (480 Mbps), USB-C |
| Power draw | 120 mA max |
| Dimensions | 1.8" × 2.2" × 0.45" |
| Weight | 0.7 oz |
| Included accessories | 19 test clips and color-coded leads, storage case |
ACTIVE-PRO Ultra

The ACTIVE-PRO Ultra is the high-bandwidth variant. It pushes logic sampling to 500 Msps, adds 8 analog channels (6 single-ended + 2 differential) at up to 50 Msps, and uses USB 3.0 SuperSpeed (5 Gbps) for maximum data throughput.
| Specification | Value |
|---|---|
| Active Debug Ports | 4 (A, B, C, D) |
| Debug channels per port | 64 |
| Graphable variables per port | 64 |
| Timestamp resolution | 1 ns |
| Logic Inputs | |
| Digital channels | 8 (D0–D7) |
| Logic sample rate | 500 Msps |
| Max measurable frequency | 100 MHz |
| Input voltage range | −25 V to +25 V |
| Logic family support | 1 V to 5 V |
| Input impedance | 1 MΩ ∥ 7 pF |
| Analog Inputs | |
| Analog channels | 8 (6 single-ended + 2 differential) |
| Analog sample rate | Up to 50 Msps |
| ADC resolution | 12-bit |
| Voltage range | −10 V to +10 V measurable; −30 V to +30 V tolerant |
| Digital Outputs | |
| Digital output channels | 2 (D0, D1) |
| Output levels | 0 V, 3.3 V, tri-state |
| PWM | 0–100% duty cycle at 390 kHz; 8 mA max drive |
| Analog Outputs | |
| Analog output channels | 2 (A0, A1) |
| DC output range | 0 V to 3.3 V variable, tri-state |
| Waveform types | Sine, ramp, triangle, square |
| Waveform frequency range | 62.5 Hz to 7.25 kHz |
| Connectivity | |
| USB interface | SuperSpeed (5 Gbps), USB-C |
| Power draw | 180 mA max |
| Dimensions | 1.8" × 2.2" × 0.45" |
| Weight | 0.7 oz |
| Included accessories | 21 test clips and color-coded leads, storage case |
Feature Availability by Model
| Feature | Active Debugger | ACTIVE-PRO | ACTIVE-PRO Ultra |
|---|---|---|---|
| Active Debug Ports | 1 (A only) | 4 (A, B, C, D) | 4 (A, B, C, D) |
| Logic analyzer (D0–D7) | — | ✓ | ✓ |
| Analog inputs | — | 3 channels | 8 channels |
| Digital outputs (D0, D1) | — | ✓ | ✓ |
| Analog outputs (A0, A1) | — | ✓ | ✓ |
| Setup menu | — | ✓ | ✓ |
| Inputs tab (full) | Threshold only | ✓ | ✓ |
| Outputs tab | — | ✓ | ✓ |
| Save/Load Configuration | — | ✓ | ✓ |
| Analog calibration | — | ✓ | ✓ |
| PacketPresenter | Port A only | Ports A–D | Ports A–D |
What All Three Tools Share
The Active Debug Port is the technology at the heart of all three products. Instrument your firmware with simple output calls — C printf, C++ cout, Python print(), or direct GPIO toggling — and the Active-Pro software captures variables, state changes, and custom messages in real time without halting execution. Messages link directly to the source code lines that generated them.
Watch Firmware Algorithms. The Active-Pro shows live internal variables as your algorithm runs. Watch loop iterations, filter coefficients, and intermediate values update in real time. No breakpoints, no disruption to timing-sensitive code.
See Firmware States and Variables. Viewing firmware debug output alongside hardware signals on a synchronized timeline shows exactly what your system is doing and when. You can see the cause and effect between your code, I/O, and communication events, even across multiple processors.
Correlate Bus Traffic to the Firmware Sending It. The Active-Pro lets you see both sides of the communication — what is happening on the bus and what your firmware is doing to send and receive it.
Measure Current and Hardware Signals. The Active-Pro links source code to current changes during power mode transitions, so you can see exactly what code is running as power ramps up or down.
Debug Multiple Processors and FPGAs. The Active-Pro streams all data to disk so you can capture long test cycles without missing anything, with a sample buffer limited only by available storage (greater than 4 trillion samples).
The Active-Pro Software is the same application across all three hardware models. It presents all captured data on a single synchronized timeline — firmware debug output, logic waveforms, protocol decodes, and analog measurements — so you can see your entire system at once.
Bring an AI Into Your Debug Session. Because the Active Debug Port captures your firmware's internal state with nanosecond precision — variables, state transitions, text output, bus traffic, and analog signals all on one timeline — that data is uniquely well-suited for AI analysis. Select any time window, press Copy AI Snapshot, and paste the entire structured capture into Claude, ChatGPT, or any other AI assistant. Describe the bug you're chasing and the AI has full context: not a screenshot, not a log file, but a complete synchronized record of everything your system was doing. For engineers using Claude Desktop, the MCP Server goes further — letting Claude control the Active-Pro directly, run captures, search for events, and pull snapshots without any manual steps. You describe what you're looking for. Claude does the work.
Key Capabilities
Active Debug Ports — Live Firmware Visibility
The Active Debug Port is the core reason this tool exists. Add four simple function calls to your firmware (ACTIVEText, ACTIVEprintf, ACTIVEValue, ACTIVELabel) and your firmware streams live debug data to the PC over a 2-wire or 1-wire connection with nanosecond timestamps. No JTAG. No halting. No breakpoints.
- Up to 64 named channels per port
- Up to 64 graphable numeric variables per port
- Supported interface modes: 2-wire synchronous, 1-wire UART, 1-wire SWV (ARM Cortex)
- Works from C, C++, Verilog, VHDL, and Python
AI-Assisted Debugging — From Snapshot to Full Control
The Active Debug Port gives you a complete, timestamped record of what your firmware was doing — and that record is exactly what an AI needs to help you find bugs faster. The Active-Pro was designed from the ground up to connect that data to AI assistants, at whatever level of integration you want.
AI Snapshot is the starting point. Place cursors around any region of interest and press Copy AI Snapshot. The application packages everything in that window — logic samples, analog measurements, protocol decodes, Active Debug firmware output, and your analysis notes — into a single structured block in the Active Firmware Trace (.aft) format. Paste it into any AI assistant and ask. The AI receives a complete, time-aligned picture of your system, not a description of it. That's a fundamentally different kind of question you can ask compared to describing a bug from memory.
The Automation API takes the next step. The application exposes a TCP socket interface on localhost:37800 that any program can drive — start and stop captures, read live logic and analog values, control signal generator outputs, move cursors, and trigger exports. If you can write a script, you can automate the entire tool.
The MCP Server is where it becomes something else entirely. It wraps the Automation API in a protocol that AI assistants such as Claude Desktop understand natively. Connect it once and your AI can control the Active-Pro directly using plain English. You describe what you want. The AI does the work.
Together, these three layers mean the Active-Pro is not just a tool you use to debug firmware — it is a tool your AI assistant can use alongside you.
Protocol Decoding
Hardware-decoded protocols (no host CPU cost): Active Debug Port, I2C/SMBus, SPI (4 variants), UART 8,N,1 (normal and inverted), EE101.
Software-decoded protocols: 1-Wire (Dallas/Maxim), 9-bit UART, LIN bus, RS-232, MDIO, CHSI, DS101.
PacketPresenter
A scripting engine that adds a second decoding layer on top of any hardware or software decoder. Write a simple text definition file describing your packet structure and the PacketPresenter parses the byte stream in real time, overlaying named, labeled packet blocks on the waveform. Numeric fields can be automatically graphed as line charts.
Source Code Integration
Link decoded Active Debug Port events back to the source file and line that generated them. Click any debug event in the waveform and the Source Code tab jumps to the exact line of firmware that produced it.
Live UI Dashboard
Your firmware can send gauge, LED, text, and progress bar widget data to the PC. The Live UI tab renders an interactive dashboard driven by your running firmware — no GUI framework needed on the embedded side.
Signal Generators
Available on: ACTIVE-PRO · ACTIVE-PRO Ultra
Drive digital output pins (D0, D1) as logic high, logic low, or PWM. Drive analog output pins (A0, A1) as fixed DC voltages or waveforms (sine, ramp, triangle, square). Control all outputs from the software in real time, or automate them via the TCP Automation API.
Notes and Analysis Context
Each capture file includes a rich-text notes editor for documenting your findings. A separate Analysis Context field accepts plain text that automatically appears at the top of every AI Snapshot export from that file — giving the AI your briefing before it sees a single data point.
Demo Mode
If you don't have hardware connected yet, press Capture in the software to launch Demo Mode. It loads a complete simulated capture — including multi-channel bus traffic, analog waveforms, and Active Debug firmware output — so you can explore the full software feature set before your hardware arrives.
System Requirements
- Windows: WinUSB driver (provided with the hardware; installs automatically)
- Linux / macOS: libusb-1.0
The application runs on Windows, macOS, and Linux.