
Best Debugger for Embedded Systems?
Best Debugger for Embedded Systems
A Firmware Engineer's Guide to Modern Debug Tools
When an engineer goes looking for a debugger, the goal is simple: find the bug, understand it, fix it. Every debugger promises the same thing at a high level, which is visibility into running code. What separates them is how they deliver that visibility, and whether it survives contact with real hardware.
In desktop and server development, the debugger lives inside the IDE. You set a breakpoint, halt, inspect variables, step through code, and repeat. That workflow is effective when you control the operating system and the environment, and when stopping the program changes nothing important about the result.
Embedded firmware breaks that assumption. On a time-critical system running against real hardware, the instant you halt the CPU you lose the thing you were trying to see. Timing relationships collapse. Interrupts stack up or get missed. Peripherals time out. The bug you were chasing either vanishes or turns into a different bug caused by the halt itself.
So it is worth being precise about what a debugger is, why the classic definition is too narrow for embedded work, and what firmware engineers actually need to solve real bugs.
What a debugger actually does
Strip away the categories and every debugger exists to do four things:
- Observe the state of running code
- Influence execution or memory to test a hypothesis
- Correlate software behavior with real-world outcomes
- Isolate the root cause
That holds whether the target is a Python service, a C++ backend, a mobile app, or firmware on a microcontroller. The differences show up in how well each tool does those four things under real conditions.
The main classes of debug tools
Software debuggers (GDB, LLDB, IDE integrations)
Pros: Mature, well documented, and tightly integrated with source. Breakpoints, watchpoints, single-stepping, and memory inspection are all first class. Hard to beat for application logic on a hosted OS.
Cons: They assume you can stop the program without consequence. On bare metal or an RTOS with tight timing, that assumption fails. They tell you the state of the code, not the timing of the system around it.
JTAG and SWD hardware debuggers
Pros: The standard for embedded bring-up. Direct access to registers, memory, and the call stack. Flashing, single-stepping, and post-mortem inspection all in one probe.
Cons: They are halt based. When you stop, you see what remained in memory after the system froze, not what actually happened leading up to it. Race conditions, missed interrupts, and asynchronous hardware events are exactly the class of bug that halting hides. Timing is gone the moment you break.
Logic analyzers and oscilloscopes
Pros: The right tool for the electrical layer. Capture signal transitions, measure timing, decode I2C, SPI, UART, and other buses, and diagnose problems the CPU never sees.
Cons: They show the outside of the chip only. You get the bus traffic and the edges, but nothing about what the firmware was deciding at that instant. You are left inferring internal state from external symptoms.
Firmware instrumentation
Pros: Instead of stopping the CPU, you add lightweight output to the firmware itself and let it report what it is doing while it runs. Function entry, state transitions, variable values, and debug strings stream out live, time-stamped, with no halt. Nothing about the timing changes.
Cons: Historically this meant printf over a UART, which is slow, intrusive, and easy to overrun. Done badly, the instrumentation becomes its own timing bug. The value depends entirely on how fast and how low-impact the output path is.
That last category is where modern embedded debugging is heading, and it is where the traditional definition of a debugger has to expand.
The Heisenbug problem
Here is the scenario every firmware engineer knows. An interrupt routine occasionally misses an event. You attach the JTAG probe, set a breakpoint, and the bug disappears. Stopping the system changed the timing, so the failure stopped happening. Now you are stuck choosing between guessing, sprinkling GPIO toggles across the code, and reading log files for hours.
The reason these bugs are so hard is that most embedded failures are not simple logic errors. They are timing bugs, race conditions, missed interrupts, and edge-triggered faults that only exist while the system is in motion. Breakpoints cannot catch them. Single-stepping cannot reproduce them. You need visibility without stopping execution, and you need it correlated with what the hardware was doing at the same instant.
One timeline for firmware and hardware: the Active-Pro family
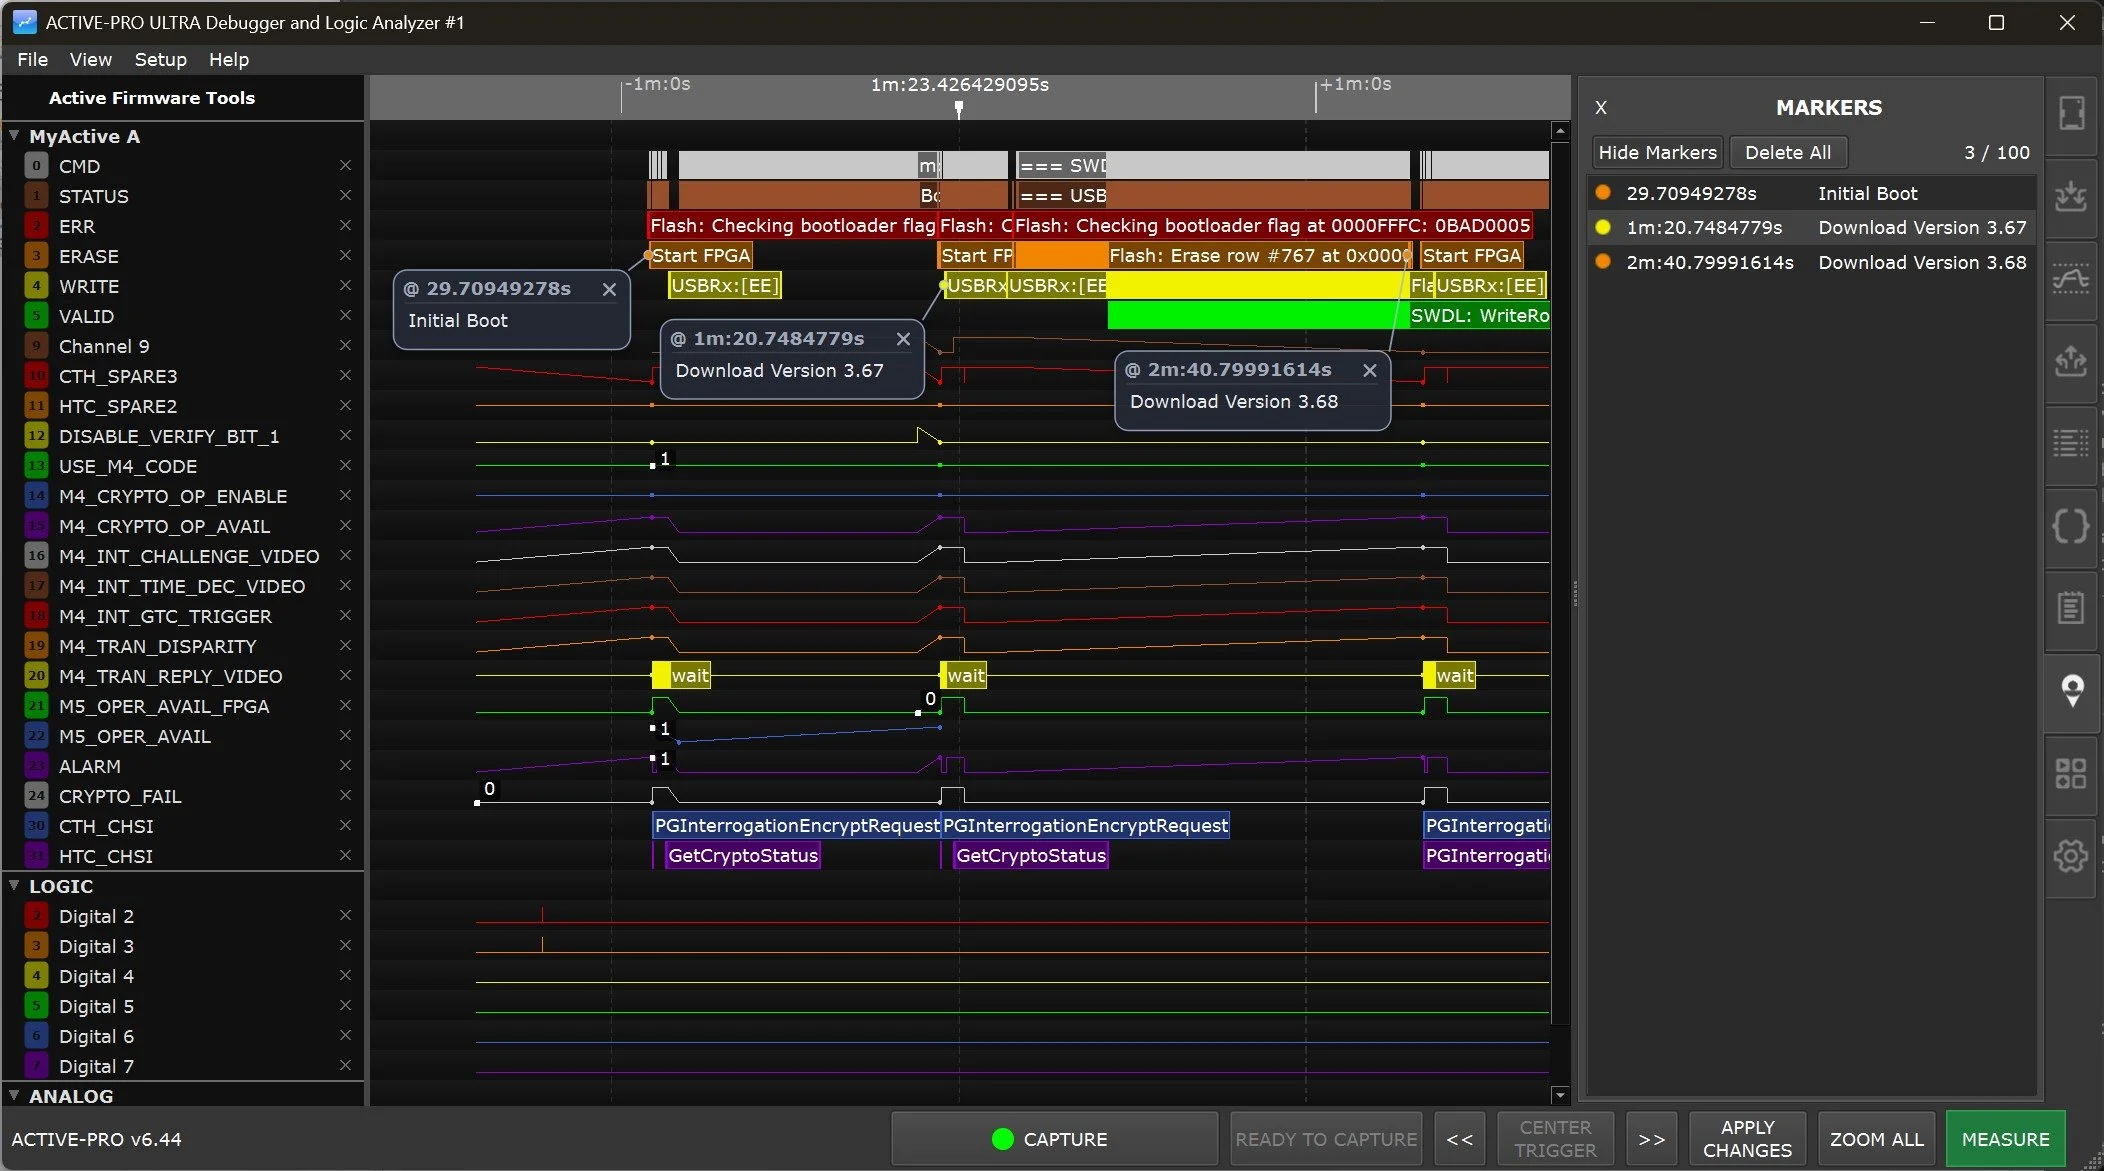
The Active-Pro family was built for exactly this problem. It combines real-time firmware instrumentation, logic analysis, analog capture, and current measurement on a single synchronized timeline, so you can see what the firmware was thinking and what the hardware was doing at the same moment.
At the core is the Active Debug Port (ADP). You add a single output call anywhere execution flows, in a state machine, a control loop, or an interrupt handler, and the firmware emits structured debug output while it runs. Output is sub-microsecond, so instrumentation runs alongside your firmware instead of interrupting it. You can drive ADP from two GPIO pins during bring-up and move to SPI or SWD later to offload the processor, without rewriting your instrumentation. Clock and data lines are sensed automatically on connect and PC-side setup is automatic, so there is no sample-rate tuning or channel assignment to get wrong.
Every event lands on the same timeline as decoded bus traffic (I2C, SPI, UART, CAN), digital logic, analog waveforms, and current. Each output links back to the exact source line that produced it. Data streams to disk during capture with a live view, so long test runs do not drop samples.
The family scales without relearning the tool. Every model shares the same software, the same ADP, and the same export pipeline:
- Active Debugger. The entry point. Two digital channels and full firmware instrumentation through ADP. Everything you need to watch your code run.
- Active-Pro. Eight digital channels at 120 MS/s, three analog channels, hardware bus decoding at 240 MS/s, and up to four simultaneous ADP device streams. The daily driver for serious multi-processor work.
- Active-Pro Ultra. USB 3.0 SuperSpeed. Eight digital channels at 500 MS/s, six analog channels at up to 50 MS/s, and 1 ns timestamp resolution across every source. Built for the tightest signals and the longest captures.
Debug output your AI can actually read
Two features connect the capture directly to an AI assistant, in a format the assistant understands.
AI Snapshot lets you right-click drag to select a time range on the waveform and press Ctrl+C. A plain-text capture in Active Firmware Trace (.aft) format lands on your clipboard: firmware debug output, decoded buses, logic transitions, analog readings, and timestamps, interleaved chronologically, plus anything you wrote in the Notes tab. Paste it into Claude, ChatGPT, Gemini, or any other chat interface and start asking questions. No screenshots, no files to upload, no re-explaining the system every time.
The built-in MCP server goes further and lets an AI client operate the instrument directly. More than 40 tools cover the full Automation API: start and stop captures, search decoded data, drive digital and analog outputs, save files, and export snapshots. It works with any Model Context Protocol compatible client.
Both AI features ship as a free update to every existing Active-Pro and Active Debugger user.
Choosing the right tool
None of these categories is wrong. They solve different problems, and the right answer depends on where the bug lives:
- Reach for a software debugger when the bug is in application logic on a hosted OS.
- Reach for JTAG or SWD for bring-up, flashing, and inspecting a system you can safely stop.
- Reach for the Active-Pro family when the problem is on the bus or in the signals, and when it lives in timing, in state, or across processors. It is a full-speed logic analyzer with hardware bus decoding and analog capture in its own right, so it covers the electrical layer that used to need a separate logic analyzer or scope. It also does the one thing those tools cannot: it shows what the firmware was doing at the same instant, on the same timeline.
That last point is why the Active-Pro family covers the last two categories at once. You get the outside view (bus traffic, logic edges, analog, current) and the inside view (firmware state, variables, events) folded into a single synchronized capture, with logic, analog, current, and AI tooling in one window instead of four tools on the bench. Stop switching instruments and start seeing cause and effect directly.
Run it in demo mode
The Active-Pro application runs with no hardware attached. Download it, press Capture, and you get a real capture on the timeline: firmware debug output, decoded buses, logic, analog, and current, all synchronized. That is the fastest way to judge whether it fits the way you work.
The same application drives all three models, so you can start small and move up later without relearning the tool. Downloads, full specs, and documentation are at activefirmwaretools.com.